Usage moves every day
Token, request, and seat charges change continuously. Static software budgets do not.
AI spend, usage, and ROI intelligence
Pharos Agent brings AI spend, usage, and ROI intelligence into one clear view. Compare providers and models, see where the month, quarter, or year is heading, optimize your AI bill, and act on the opportunities that matter.
Measure token economics, connect AI costs to business outcomes, and get deeper analytics on your spend and usage against industry, geography, and growth-stage peers.
For solo builders, teams, and companies. Free for solo builders.
Normalized on FOCUS: the FinOps Open Cost and Usage Specification · read-only reporting · incremental sync · no model traffic in the data path
Twelve months of AI spend across every category Pharos covers. Sample figures, not a customer workspace.
Usage, 12 months
16.5B → 109B tokens6.6×
Unit cost per 1M tokens
$1.61 → $0.88−45%
Spend
$61.2K → $158.9K2.6×
Sample figures · unit cost falls, but volume rises faster
Months shown: Sep '25, Oct '25, Nov '25, Dec '25, Jan '26, Feb '26, Mar '26, Apr '26, May '26, Jun '26, Jul '26, Aug '26. Milestones: JAN 2026, Coding agents roll out; MAR 2026, Support copilot ships to all queues; MAY 2026, Prompt caching enabled fleet-wide.
Supported AI stack
Tools purchased for people and teams, where licence cost and adoption begin.
 Cursor
 Replit
 Emergent
 GitHub Copilot
Direct model access billed by tokens, requests, audio, or credits.
 OpenAI
 Anthropic
 Google Gemini
 Perplexity
 Mistral AI
 Cohere
 Groq
Groq DeepSeek
 xAI
xAI ElevenLabs
Routing, hosted inference, and serverless compute between workloads and models.
 OpenRouter
 Ramp Router
 Together AI
 Fireworks AI
 Anyscale
 Baseten
 Modal
Modal Fal.ai
AI spend embedded in cloud bills, usage tables, platform credits, and DBUs.
 Amazon Bedrock
 Azure OpenAI
 Google Vertex AI
 Snowflake
 Databricks
Solo builders get clarity. Teams assign ownership. Companies govern spend.
See personal API spend, forecast the month, and get warned before you cross your limit. Free, with no credit card or expiring trial.
Assign keys and projects, set shared budgets, and give every owner the same view of spend.
Give finance, engineering, and procurement one governed record of cost, usage, ownership, and invoices.
Why it breaks
Usage moves daily, ownership is fragmented, and finance sees the problem last.
Token, request, and seat charges change continuously. Static software budgets do not.
Engineering chooses the tools. Finance receives the bill. Procurement sees neither until renewal.
By month close, the opportunity to correct routing, usage, or budget drift is gone.
How it works
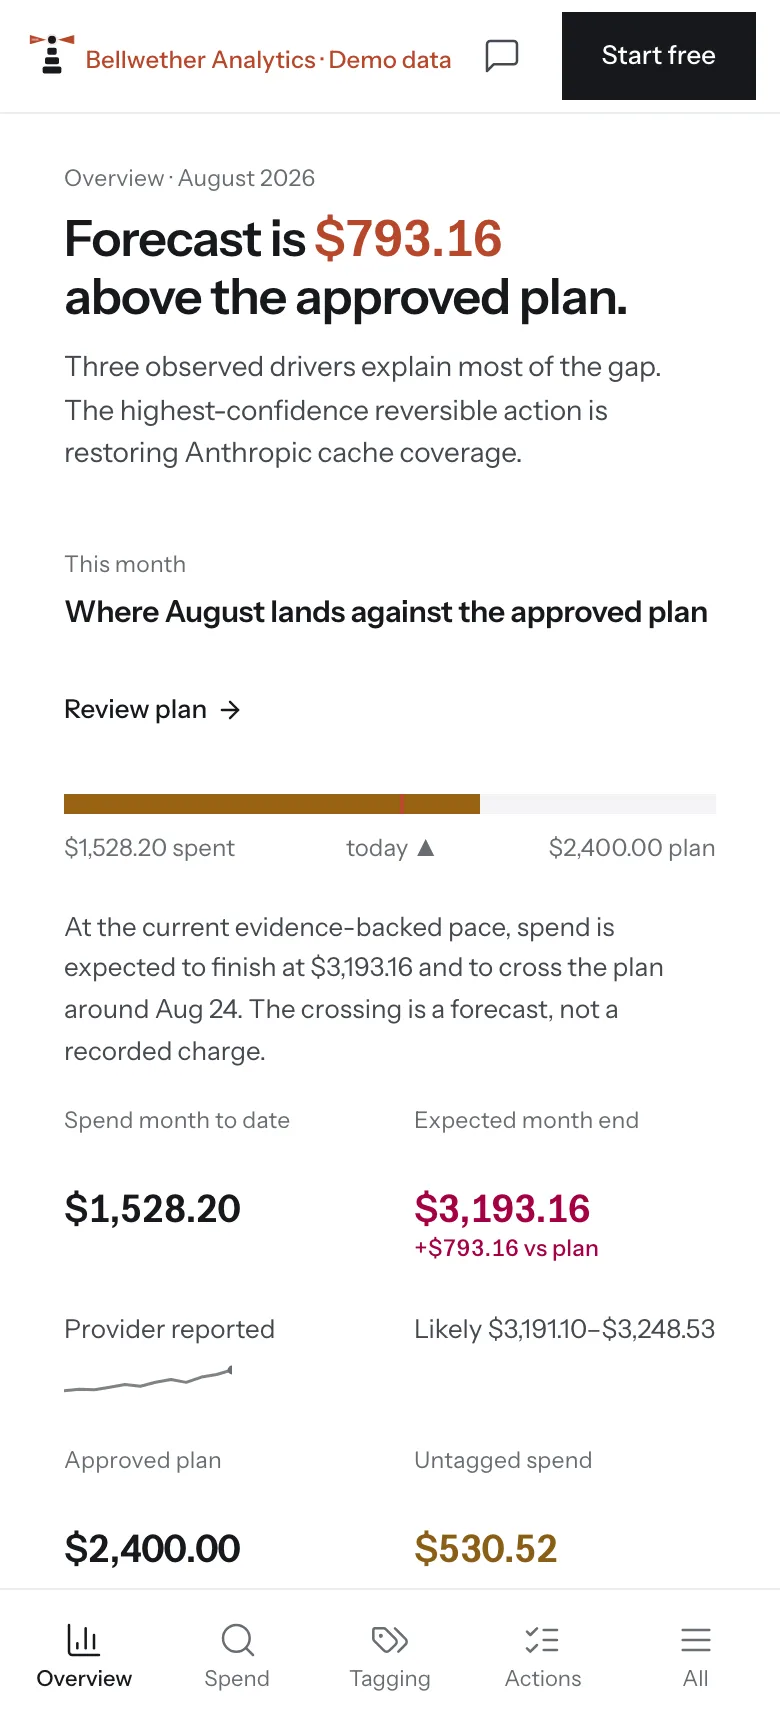
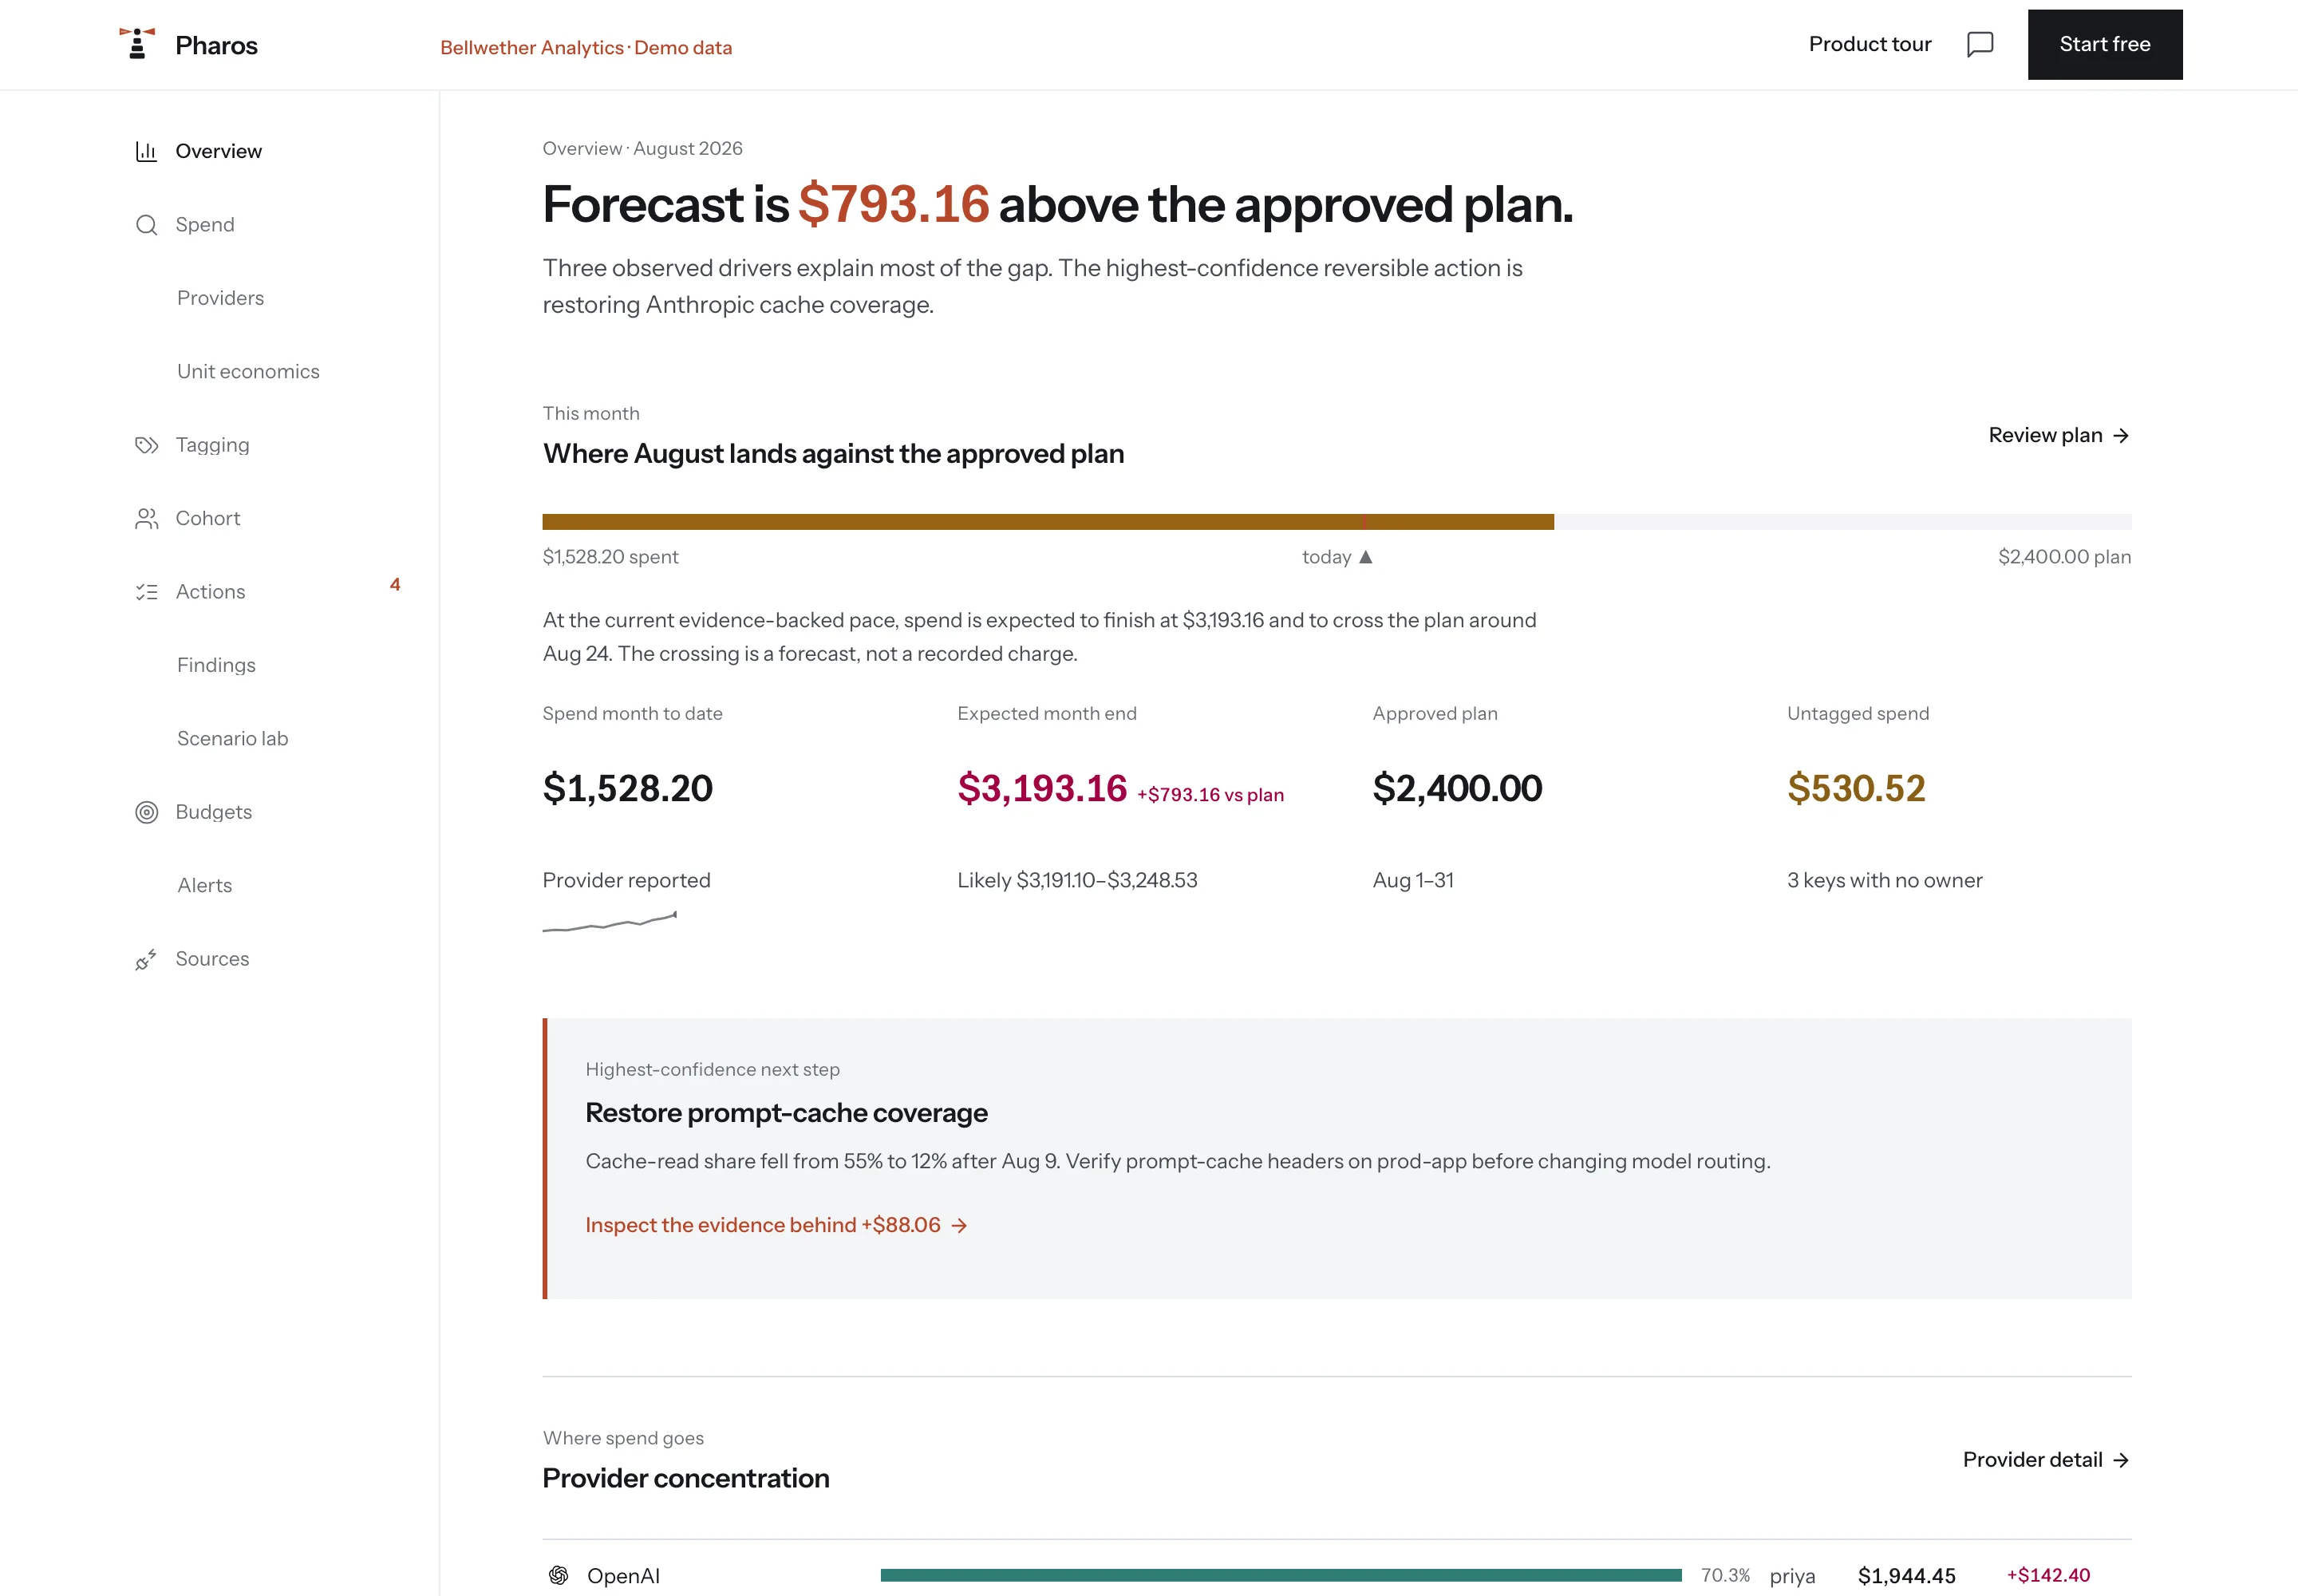
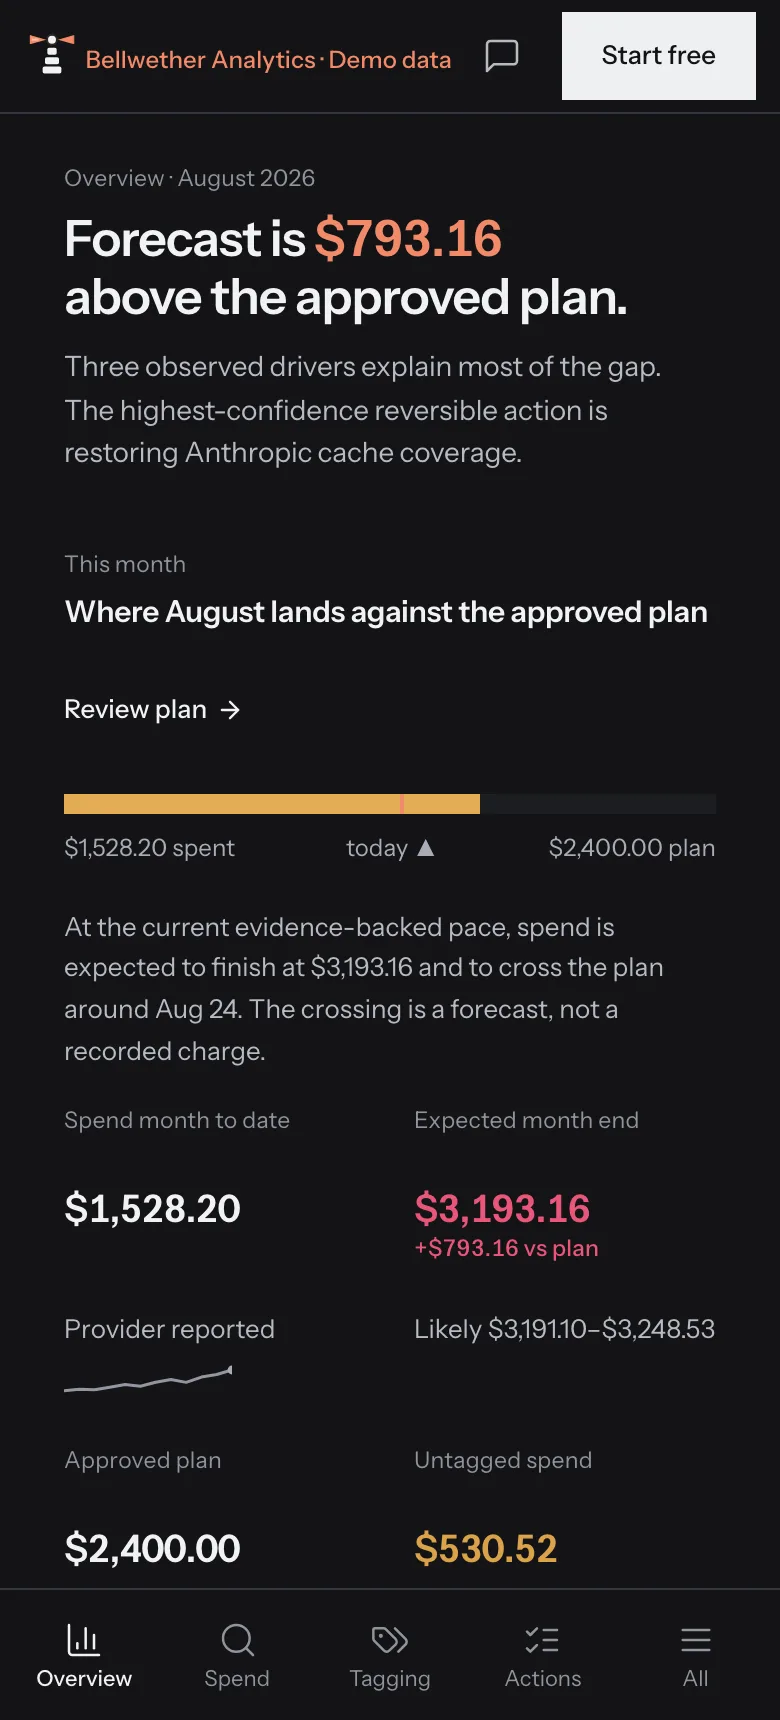
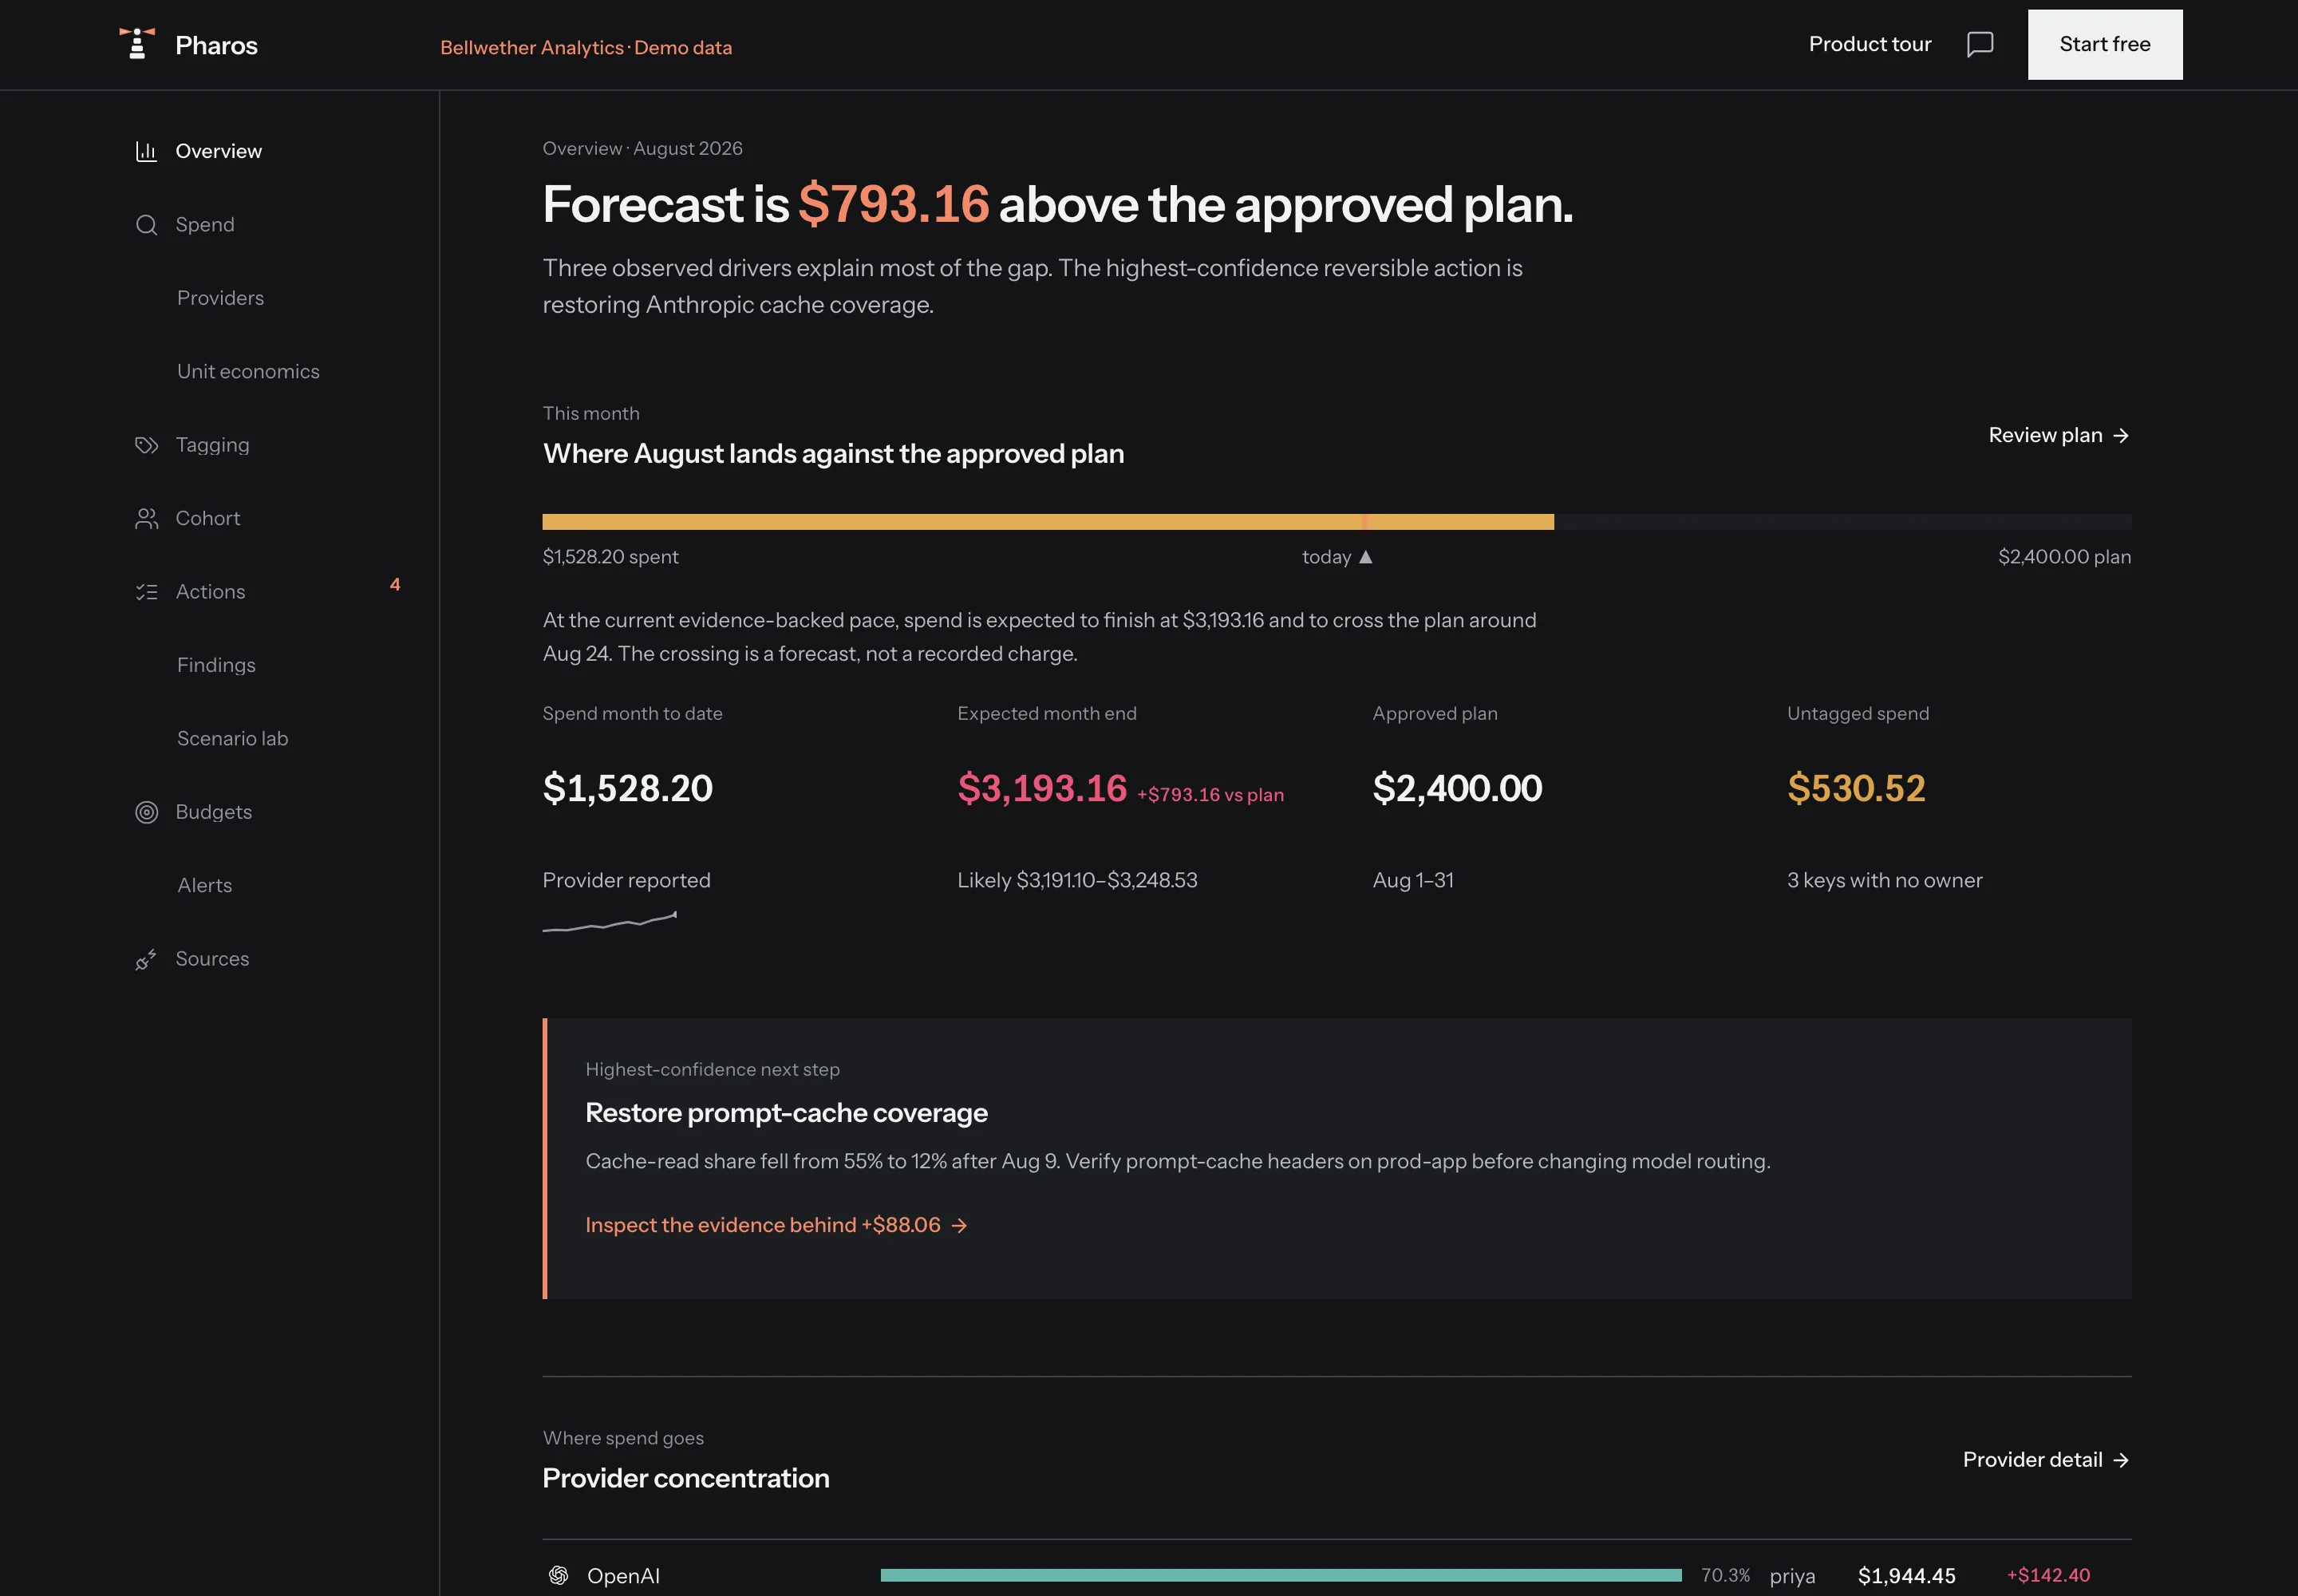
See the gap. Know the first move.
The executive view pairs the forecast, plan, and highest-confidence action.
Bring cost and usage into one ledger.
Use read-only APIs where providers support them. Add invoices or exports for the rest.
Separate volume, price, and model mix.
See what changed, what caused it, and how unit economics moved.
Set limits before spend drifts.
Forecast against budgets and route alerts by email or Slack.
Show the source behind every figure.
Keep provider, invoice, and estimated values distinct from dashboard to export.
Where it lands
Pharos scores every forecast against the month that followed. The dashed line behind the divider is what it predicted, so the misses sit on the chart instead of in a footnote.
Each miss corrects the next forecast. The model follows your spending as it moves, rather than a curve someone fitted once.
The range comes from how wrong the model has recently been. It tightens as the model improves, and it never claims a precision the record does not support.
The dashed line is what Pharos forecast a month ahead, at every month. The hairlines are how far off it was. Sample figures, not a customer workspace.
Last closed month · Aug '26
$158.9K
Invoice matched
Forecast · Nov '26
$191.7K+$26.7K vs plan
Pharos estimate
Average miss · last 5 months
3.3%from 6.5%
Pharos estimate
80% range · Nov '26
$177.9K to $205.5K
Pharos estimate
Plan $165.0K/mo · the forecast passes it in Sep '26 · sample figures
Measured months: Sep '25 $61.2K, Oct '25 $67.2K, Nov '25 $71.9K, Dec '25 $70.1K, Jan '26 $79.3K, Feb '26 $87.5K, Mar '26 $102.6K, Apr '26 $117.4K, May '26 $131.0K, Jun '26 $142.1K, Jul '26 $152.8K, Aug '26 $158.9K. Forecast made a month ahead, against what happened: Nov '25 forecast $67.2K, actual $71.9K, missed by 6.5 percent; Dec '25 forecast $77.8K, actual $70.1K, missed by 11.0 percent; Jan '26 forecast $77.6K, actual $79.3K, missed by 2.2 percent; Feb '26 forecast $84.4K, actual $87.5K, missed by 3.5 percent; Mar '26 forecast $93.1K, actual $102.6K, missed by 9.3 percent; Apr '26 forecast $108.9K, actual $117.4K, missed by 7.2 percent; May '26 forecast $126.4K, actual $131.0K, missed by 3.5 percent; Jun '26 forecast $142.5K, actual $142.1K, missed by 0.2 percent; Jul '26 forecast $154.9K, actual $152.8K, missed by 1.4 percent; Aug '26 forecast $165.6K, actual $158.9K, missed by 4.2 percent. Forecast months: Sep '26 $171.2K, 80% range $163.2K to $179.2K; Oct '26 $181.4K, 80% range $170.1K to $192.7K; Nov '26 $191.7K, 80% range $177.9K to $205.5K.
The agent
Ask why costs changed, where the current period is heading, or what to do next. Pharos selects the specialist best suited to the question, from planning and unit economics to invoice review and governance.
Answers use your current workspace data and name the source records behind every figure. Suggested questions adapt to the information you have connected.
The agent reads FOCUS-aligned cost and usage first, then adoption and business-value records where they exist. FOCUS standardizes the first layer; Pharos supplies the context needed for adoption and ROI analysis.
Code calculates every figure. Ask Pharos explains those results, compares options, and points to the records used in the answer. It never computes a number itself.
Six specialists route each question to an operating advisor, planner, unit-economics and routing expert, invoice explainer, incident investigator, or governance advisor.
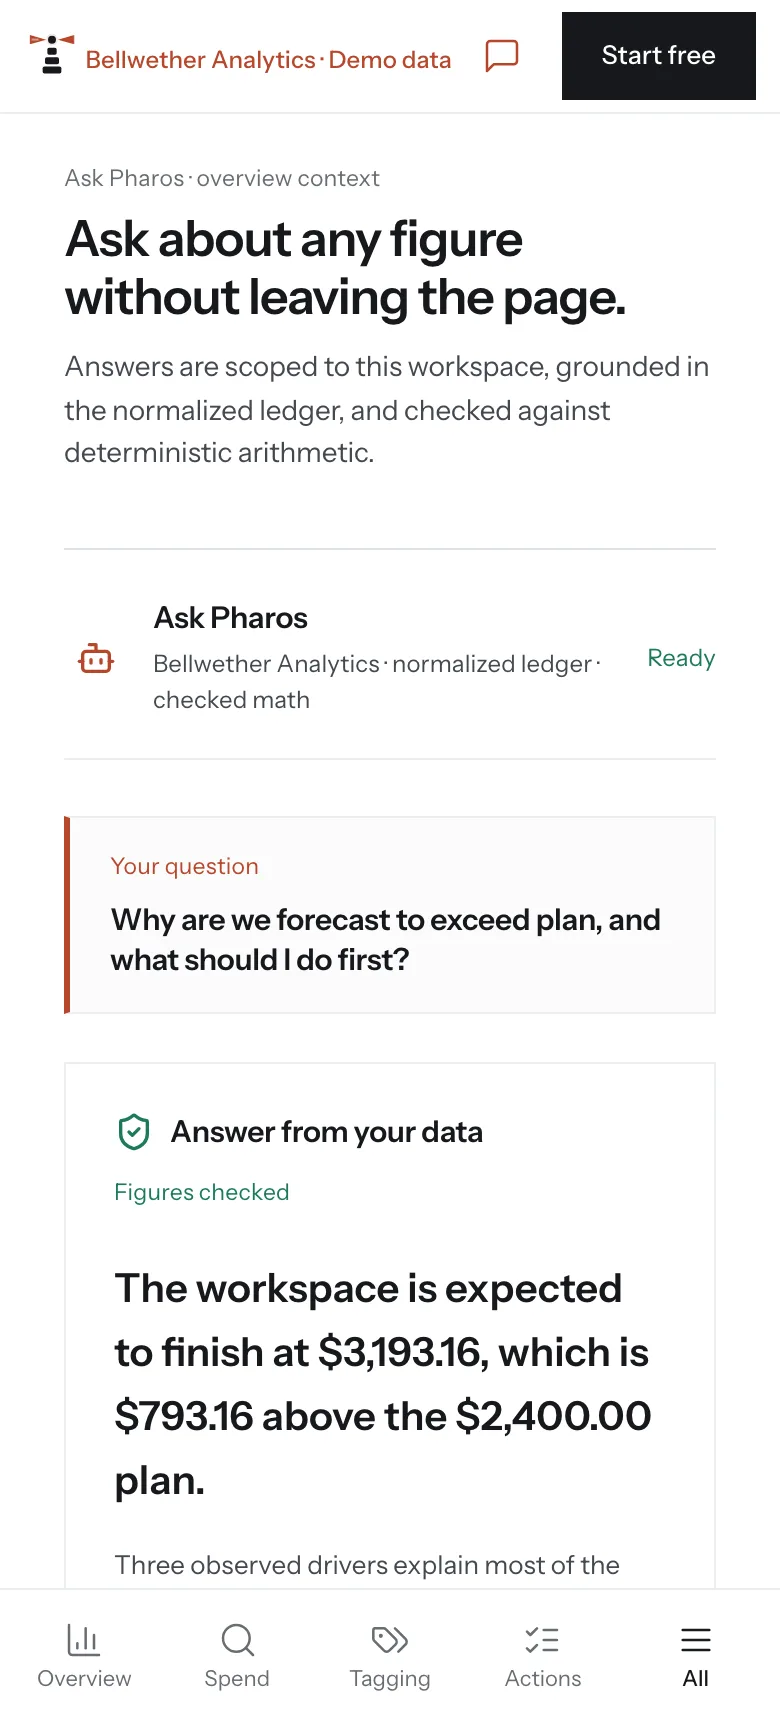
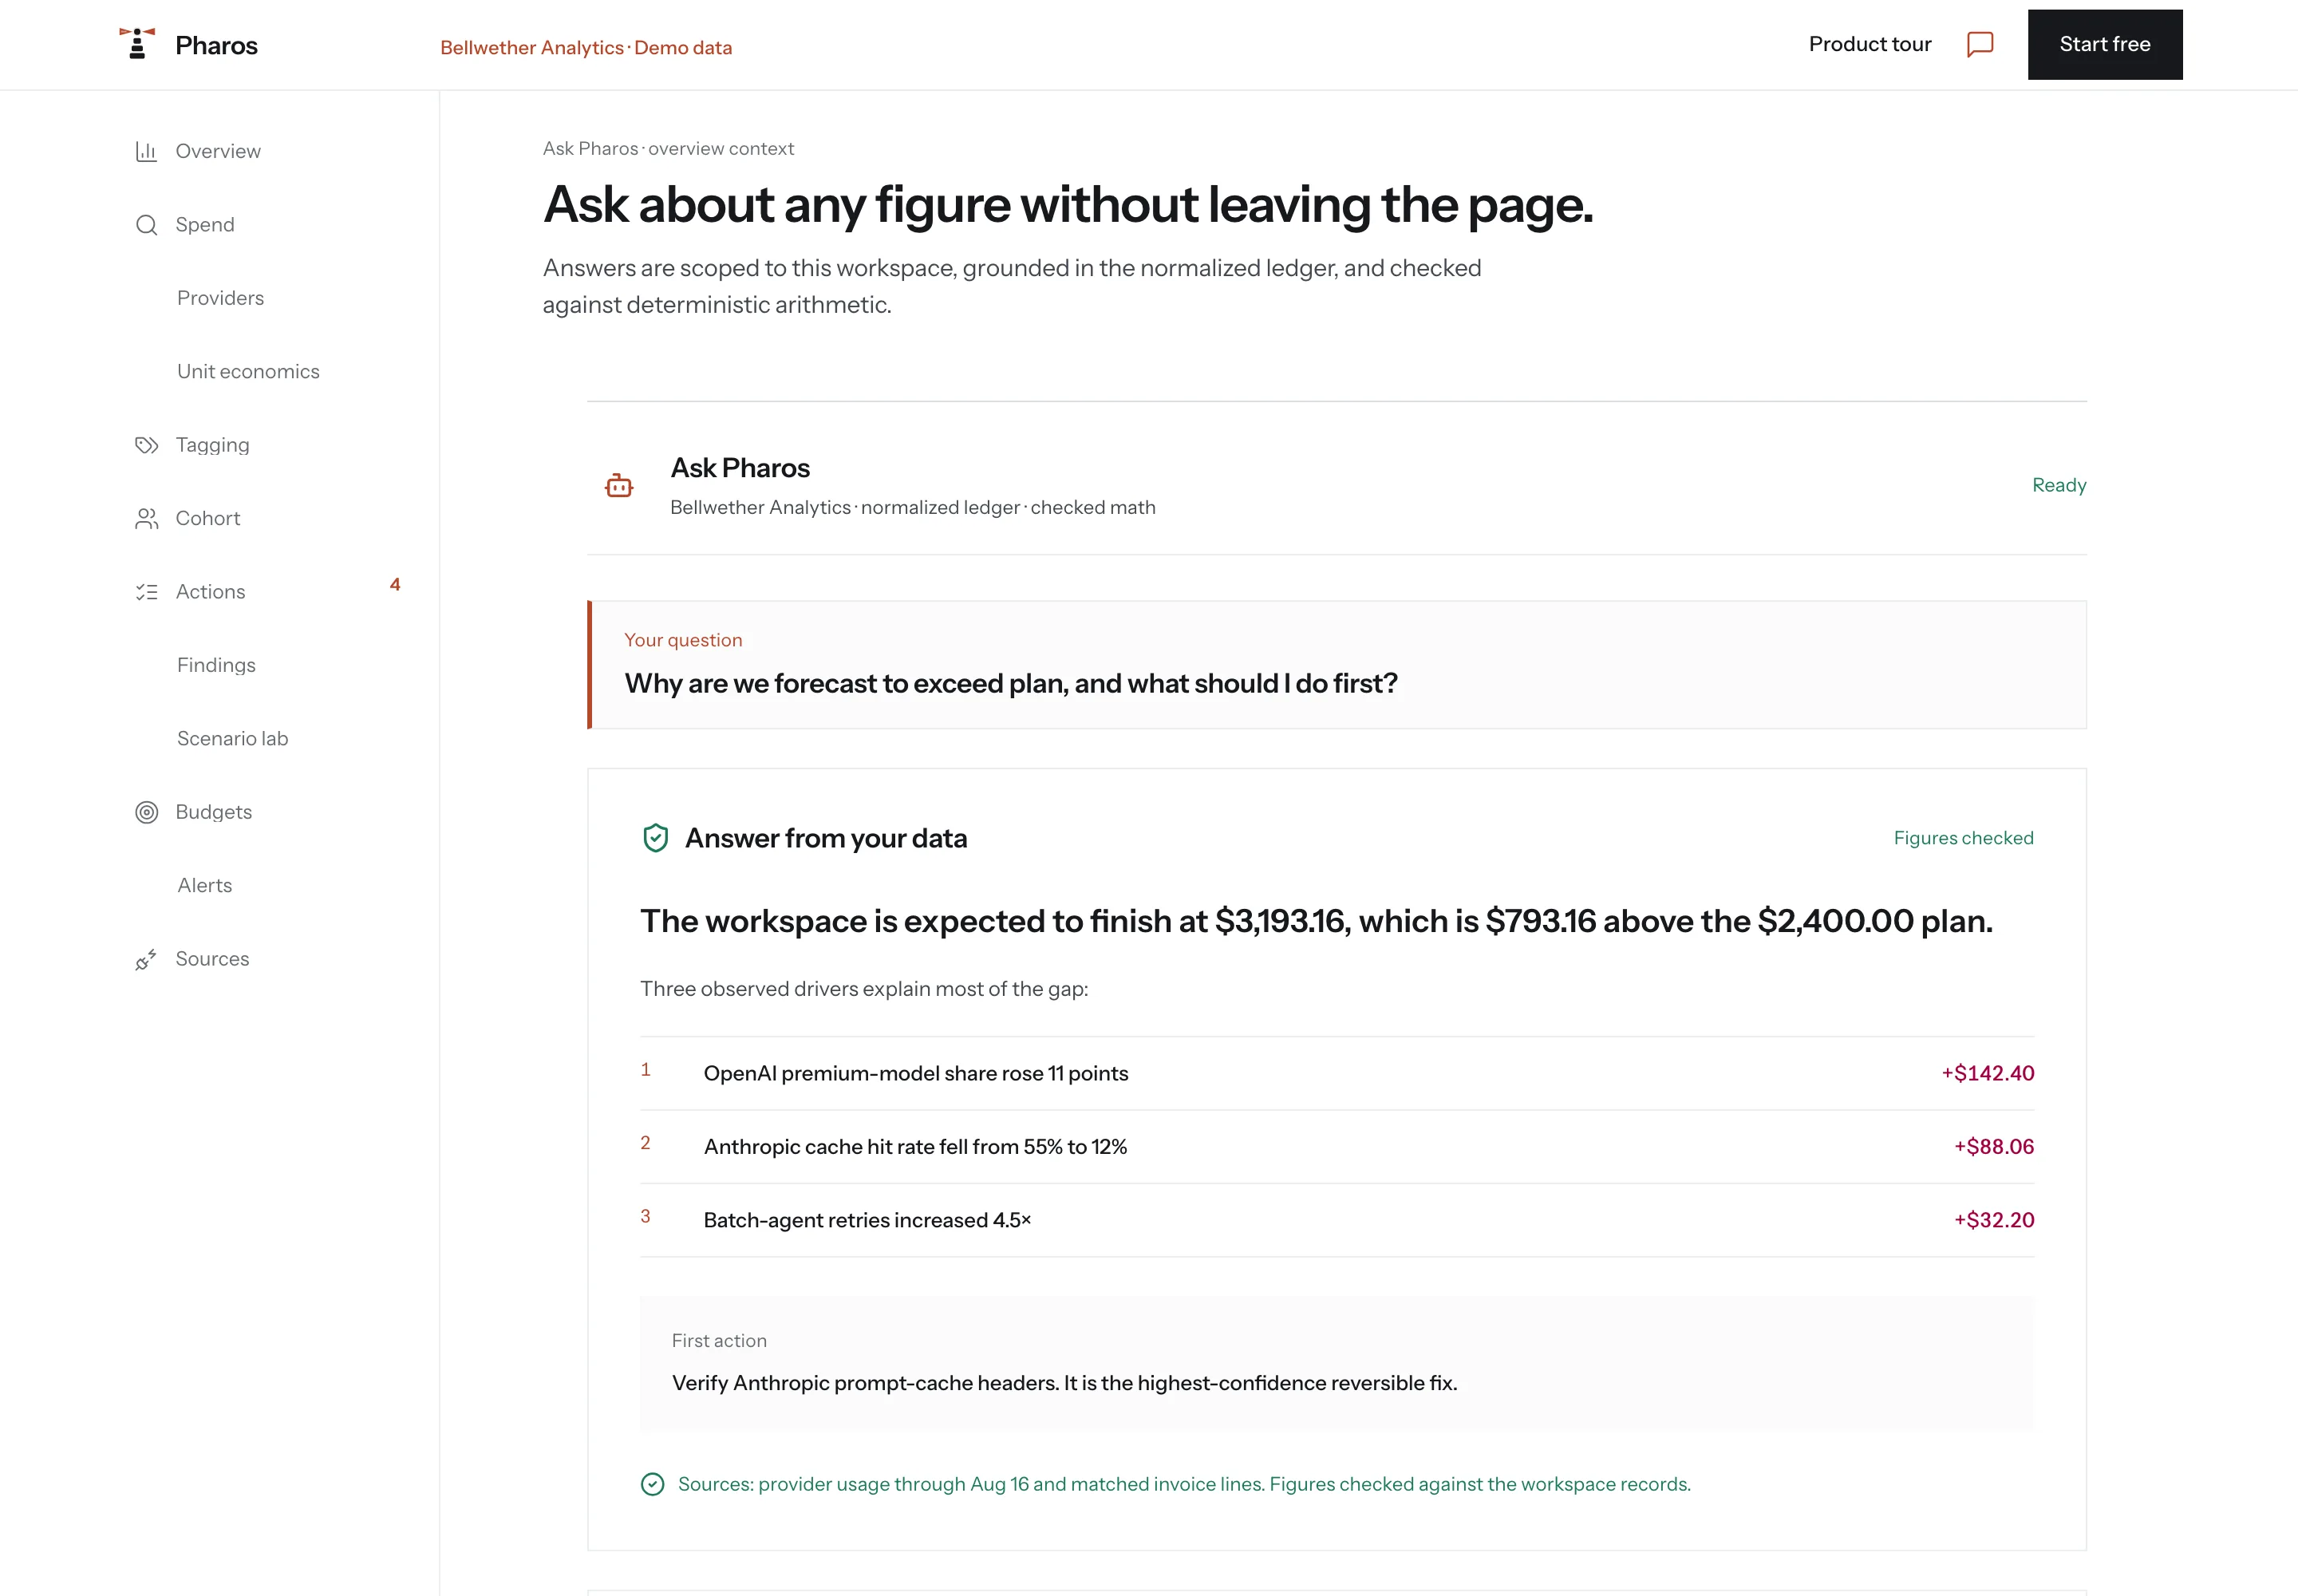
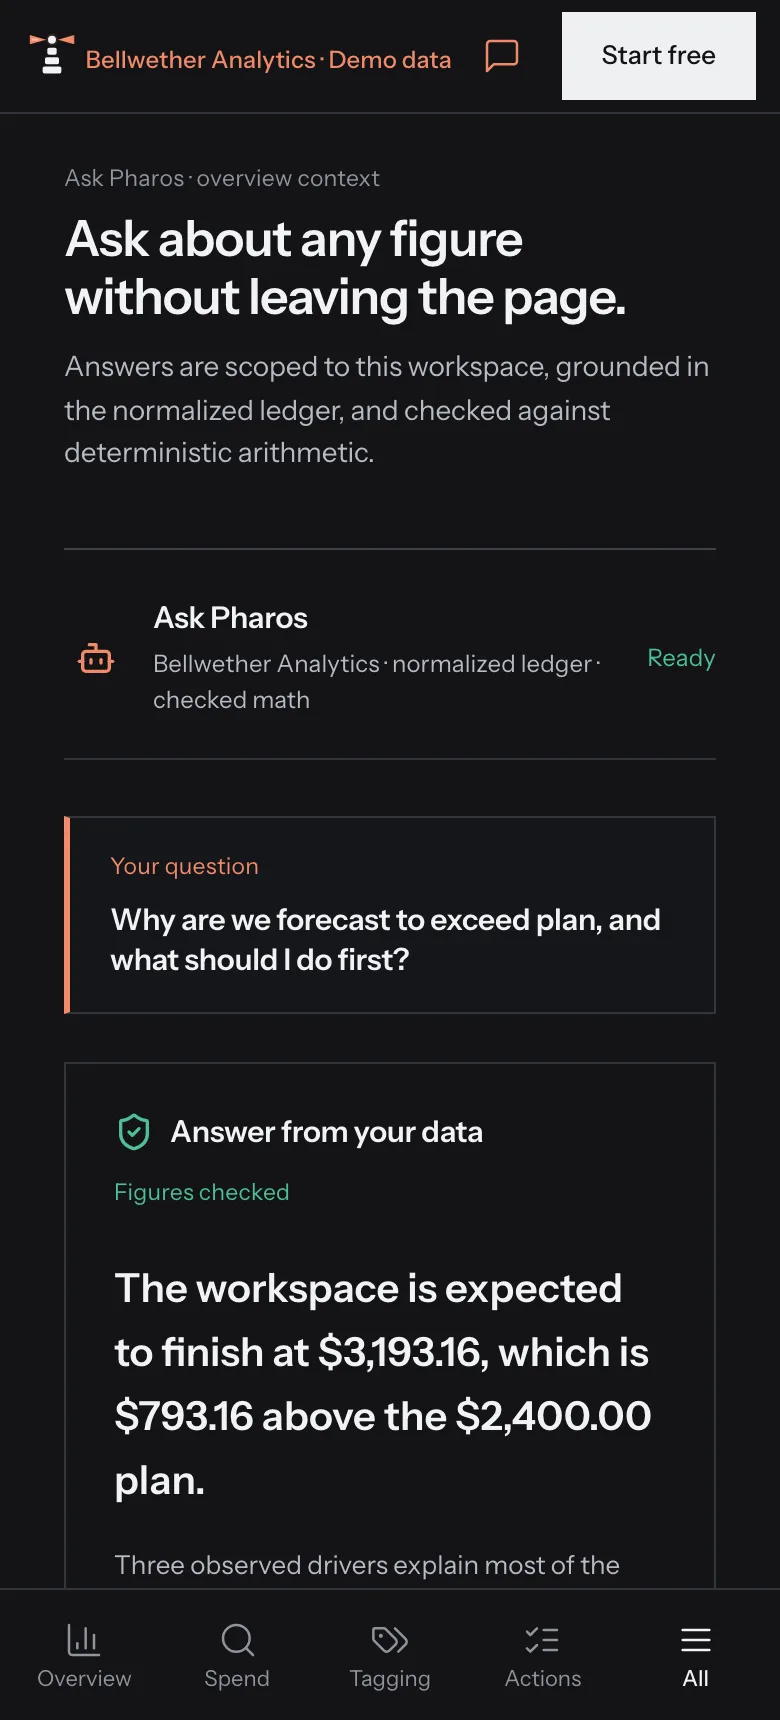
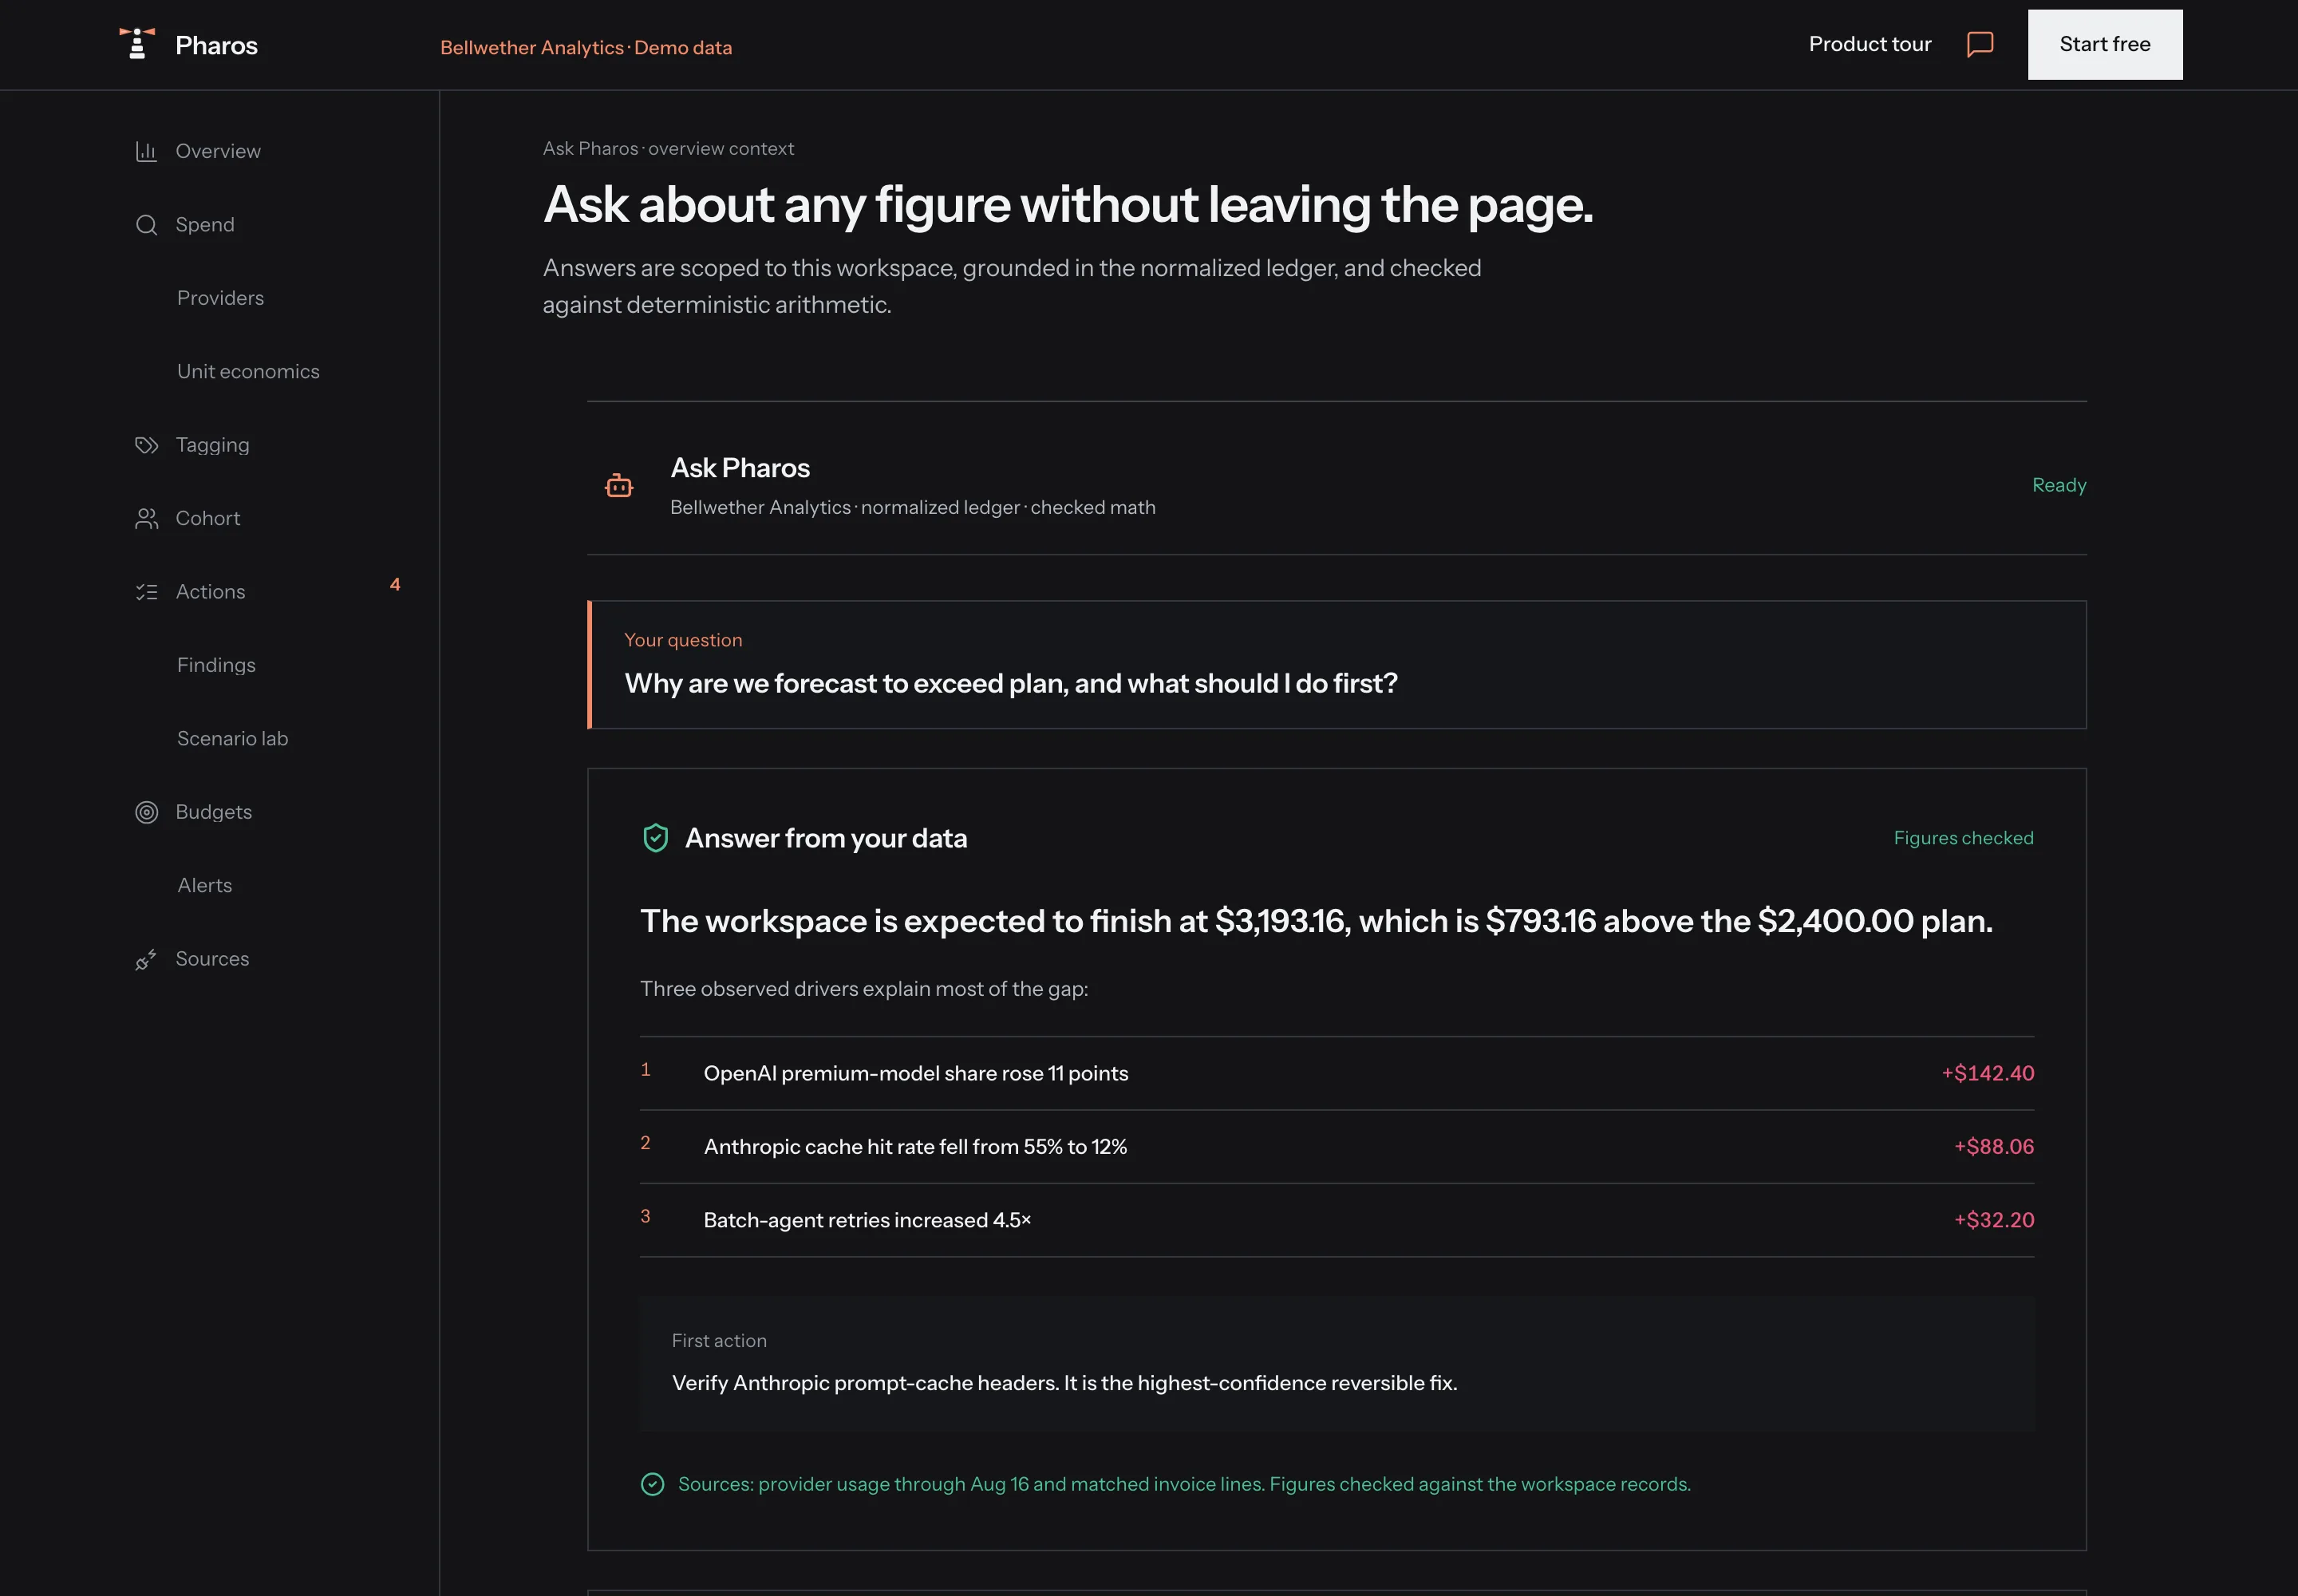
Every figure in the answer was computed by code.
The agent reads the ledger and cites it. It never does the arithmetic on a number you are shown.
Evidence
Provider reported, invoice matched, or clearly labeled as a Pharos estimate.
Code does the math. No language model computes a figure you are shown. The agent only explains numbers that code already produced.
Missing data shows a dash. A dash means Pharos has no measurement for that value. It never means zero.
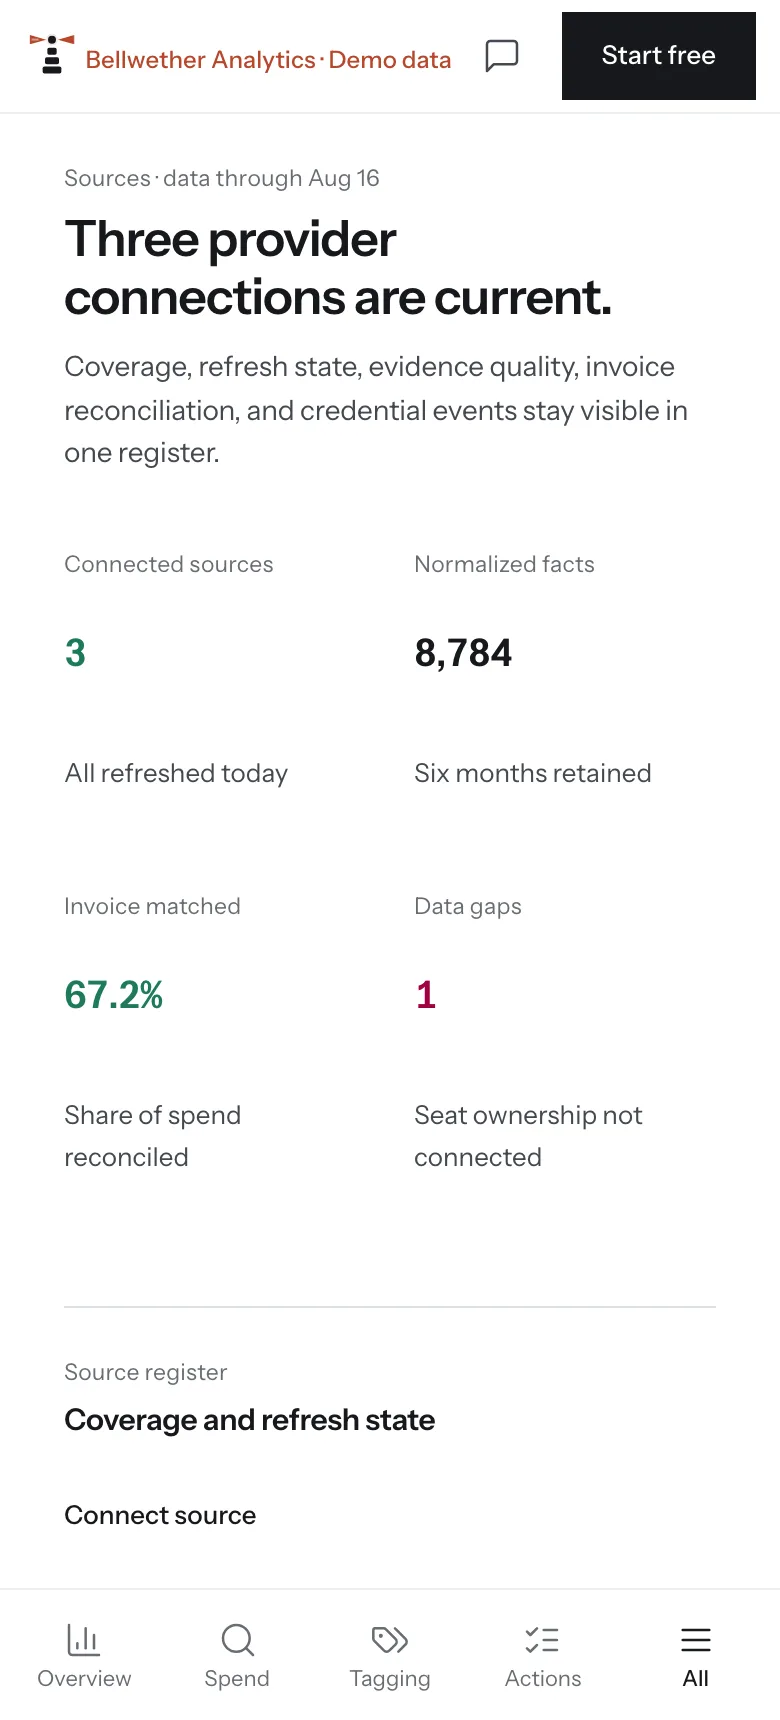
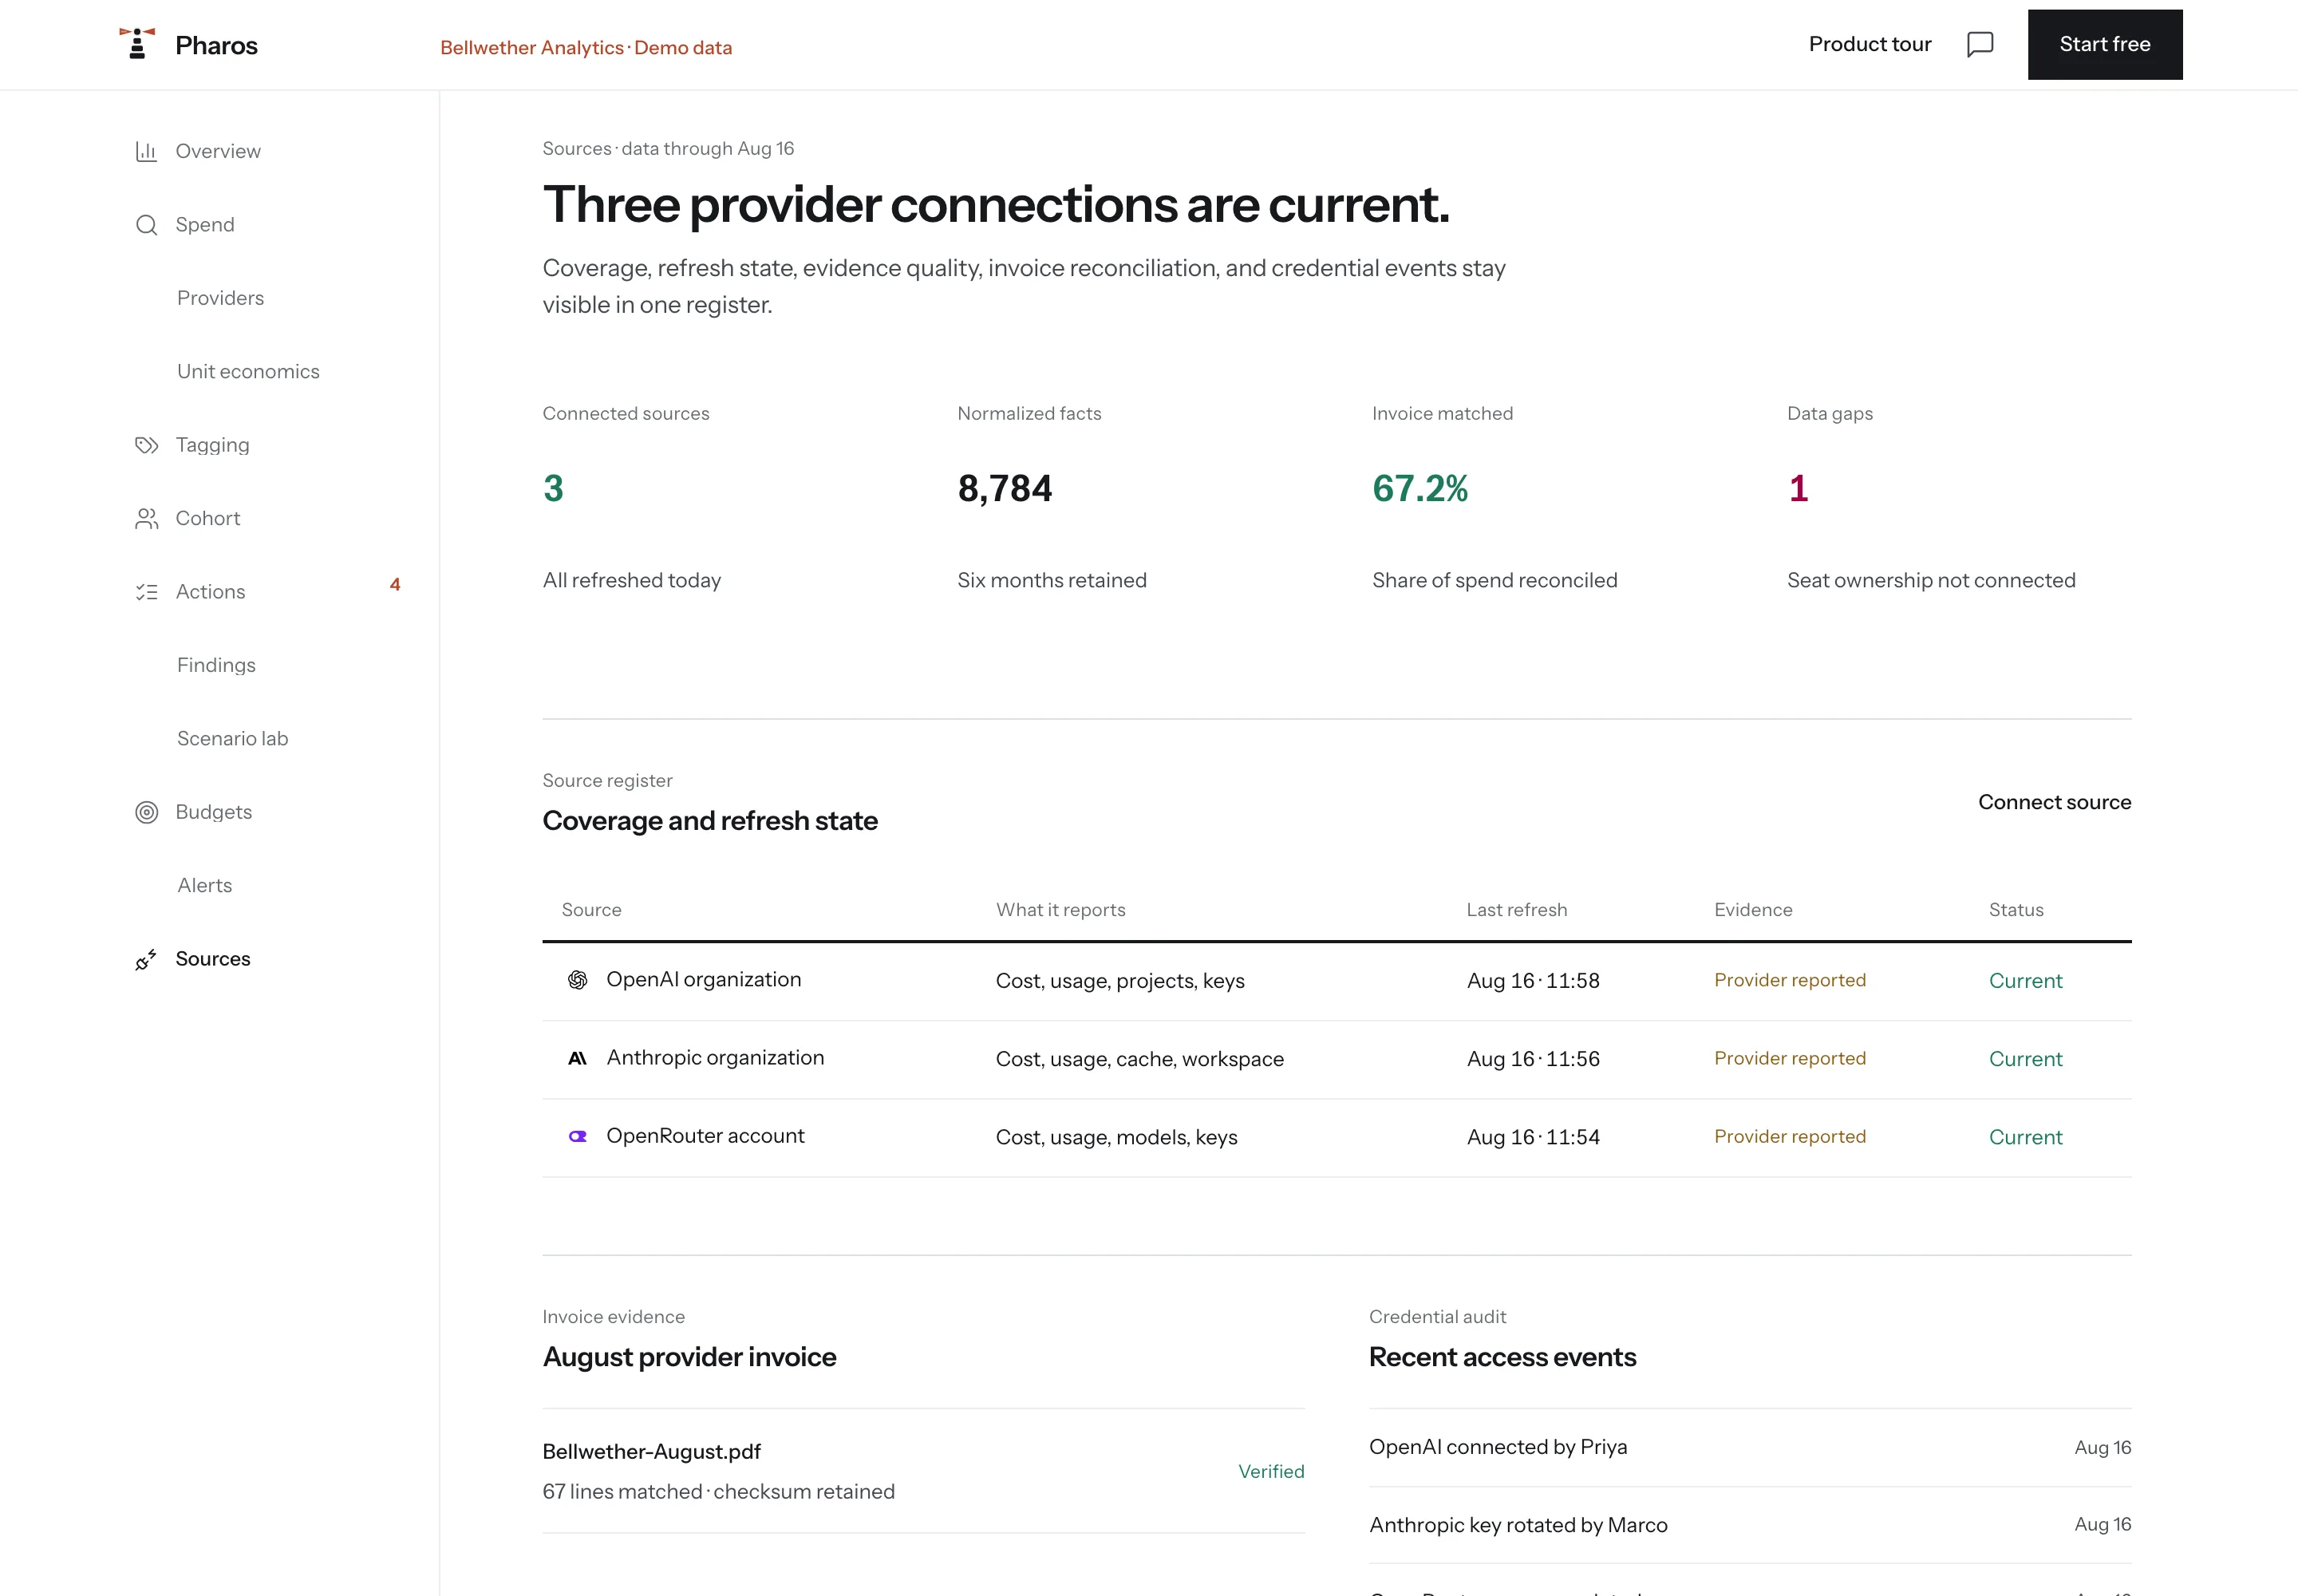
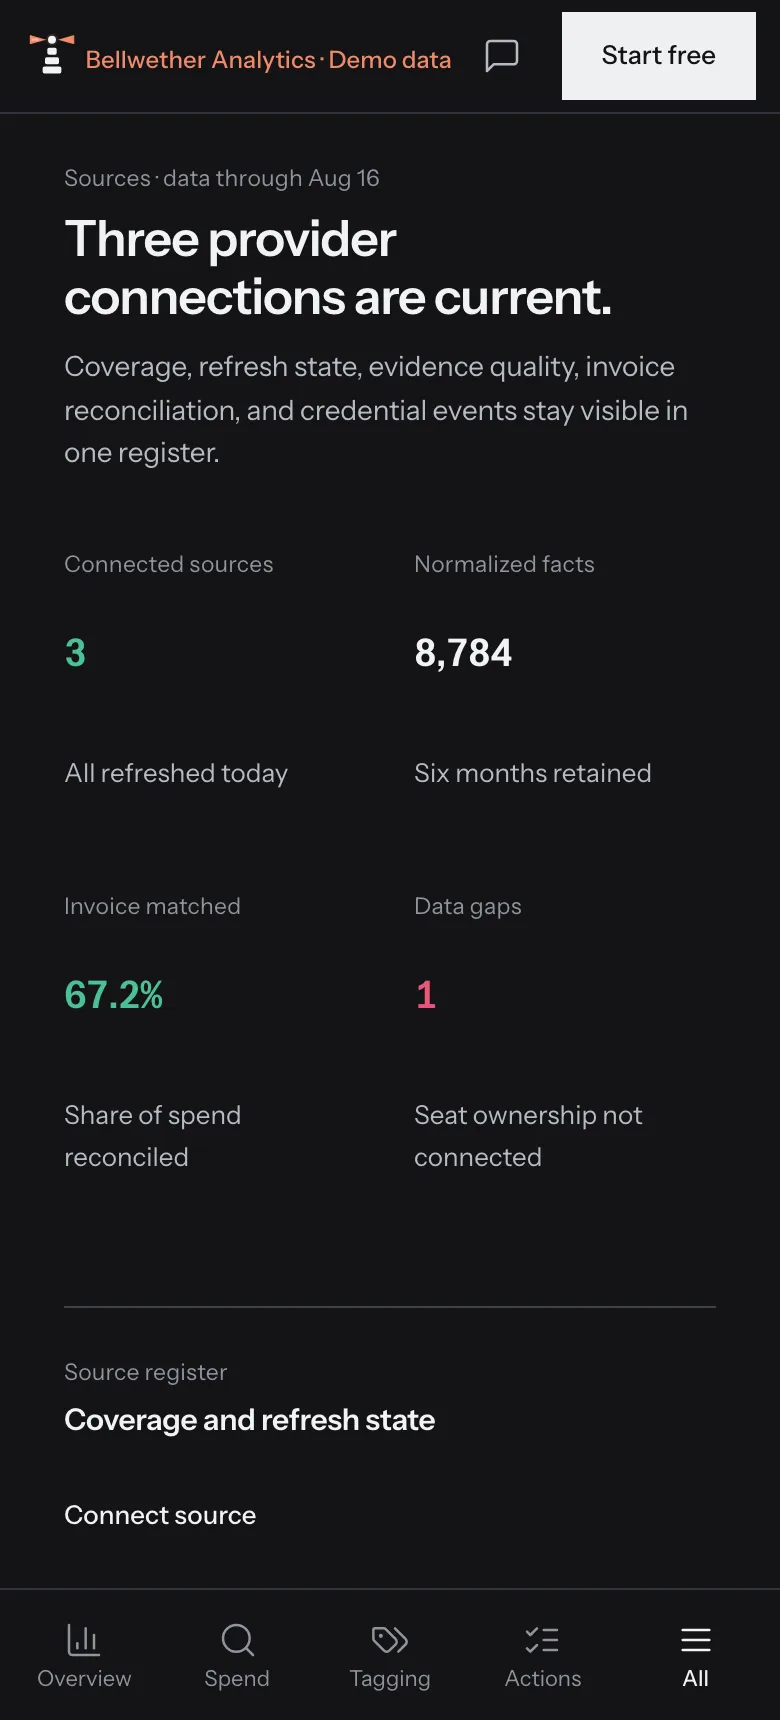
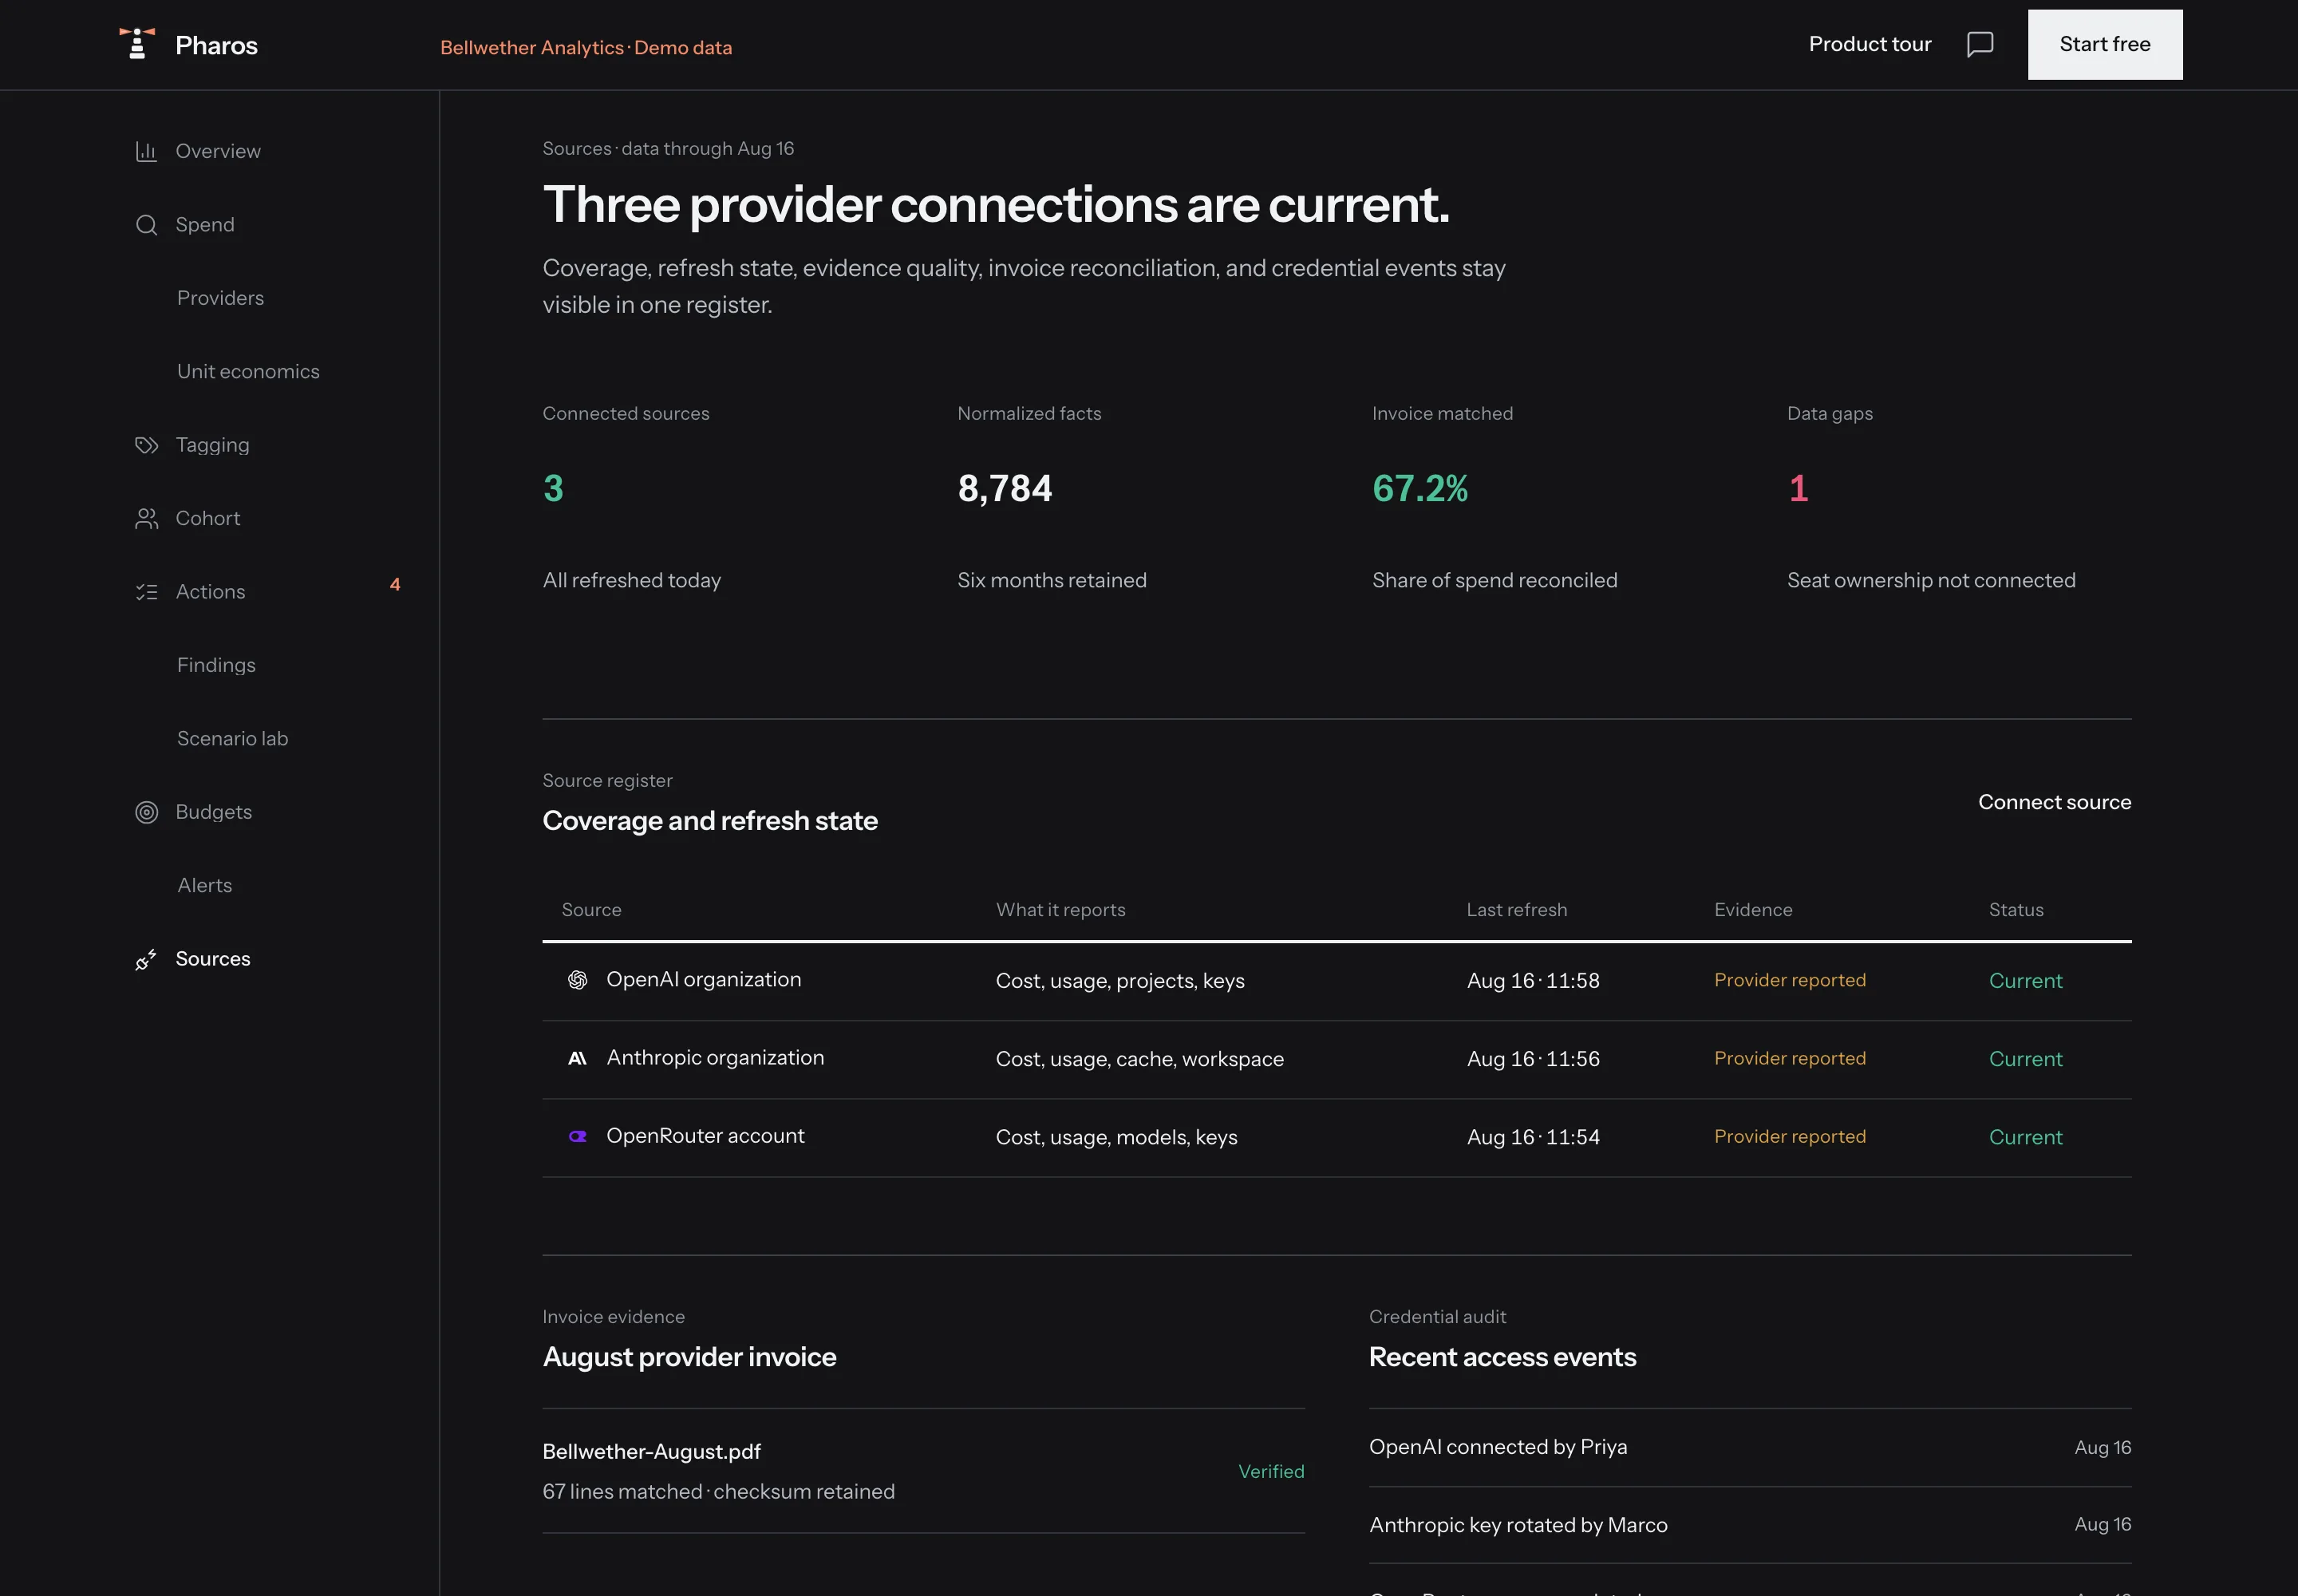
Coverage, freshness, and gaps in one register.
Each connection shows what it reports, when it refreshed, and what remains missing.
Inside the workspace
Every provider and gateway in one total. Open any model, project, key, team, or person the source reports.
Five at a time, at most. Each one says what it is worth in dollars and shows the records behind it.
Where the month lands, with an 80% range and how wrong past forecasts were. Save a scenario to test a change before you commit to it.
Cost per million tokens, and cost per outcome you register: a resolved ticket, a merged change, a report produced.
Agent traffic looks like ordinary API spend until you split it out. Register a workflow and you get its runs, owners, and outcomes separately.
List prices and model retirement dates, matched to what you run. So do your credits, commitments and renewal dates.
Every savings figure traces back to a rule you can read on the page.
A daily brief, a board pack, an incident review. Each one saves as a snapshot nobody can edit, and exports to CSV, PDF, or Markdown.
Move from topline spend to unit economics, peer context, and business outcomes.
Why did cost change?
Separate volume, price, and model mix.
Pharos reconciles the drivers to the total change.
Are we efficient for our peers?
Compare within your industry, size, and stage.
Pharos publishes private cohort percentiles once at least 10 companies qualify.
What did the spend produce?
Measure cost per outcome.
Connect AI spend to resolved tickets, merged changes, agent runs, or another business result.
Can leadership trust it?
Every figure carries a source label.
Provider-reported, invoice-matched, and estimated values remain distinct.
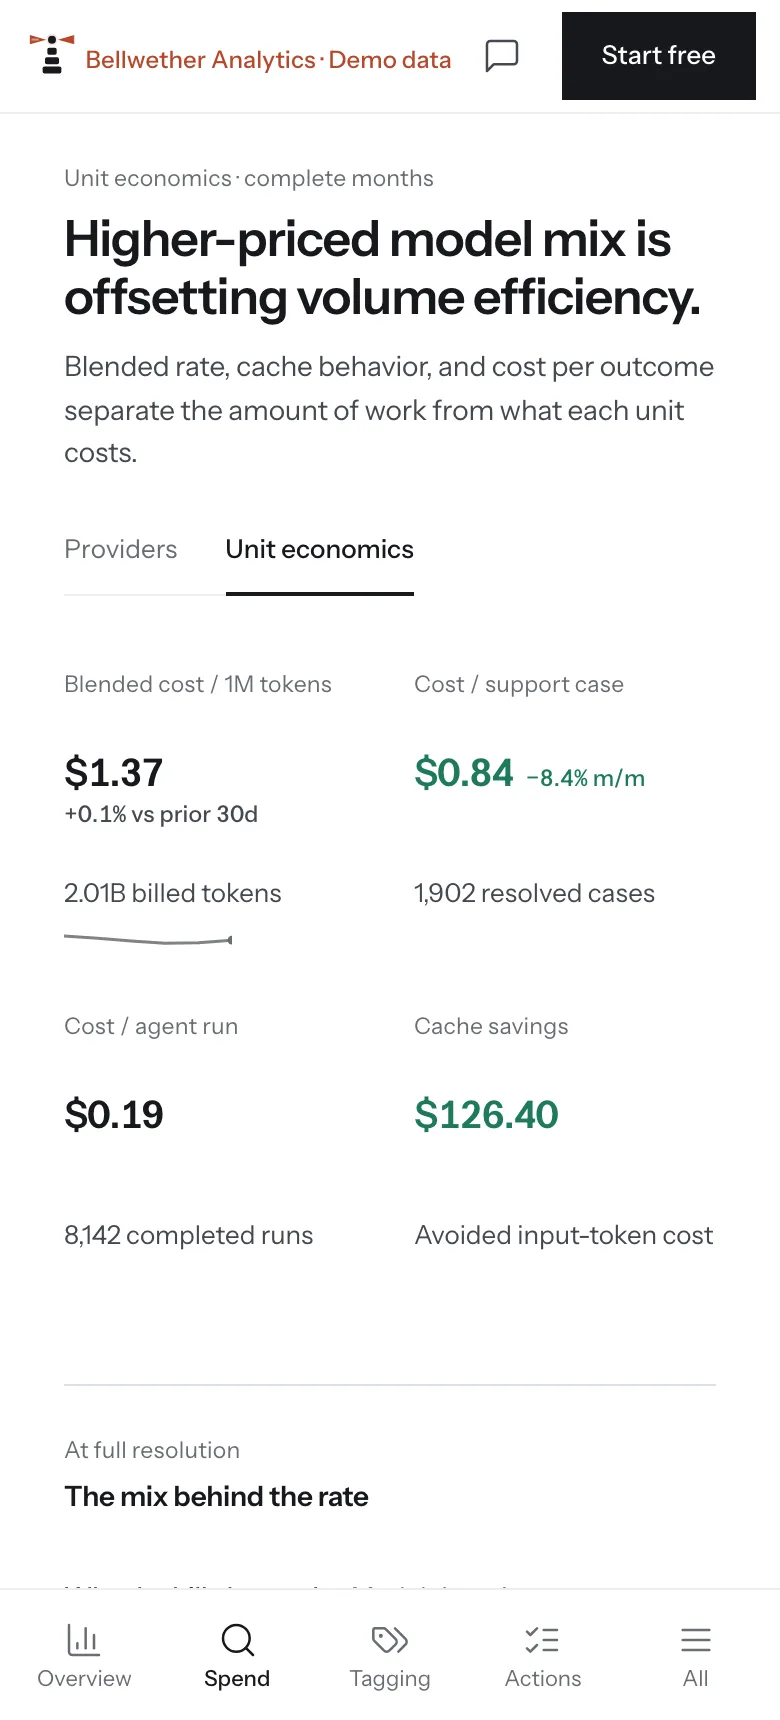
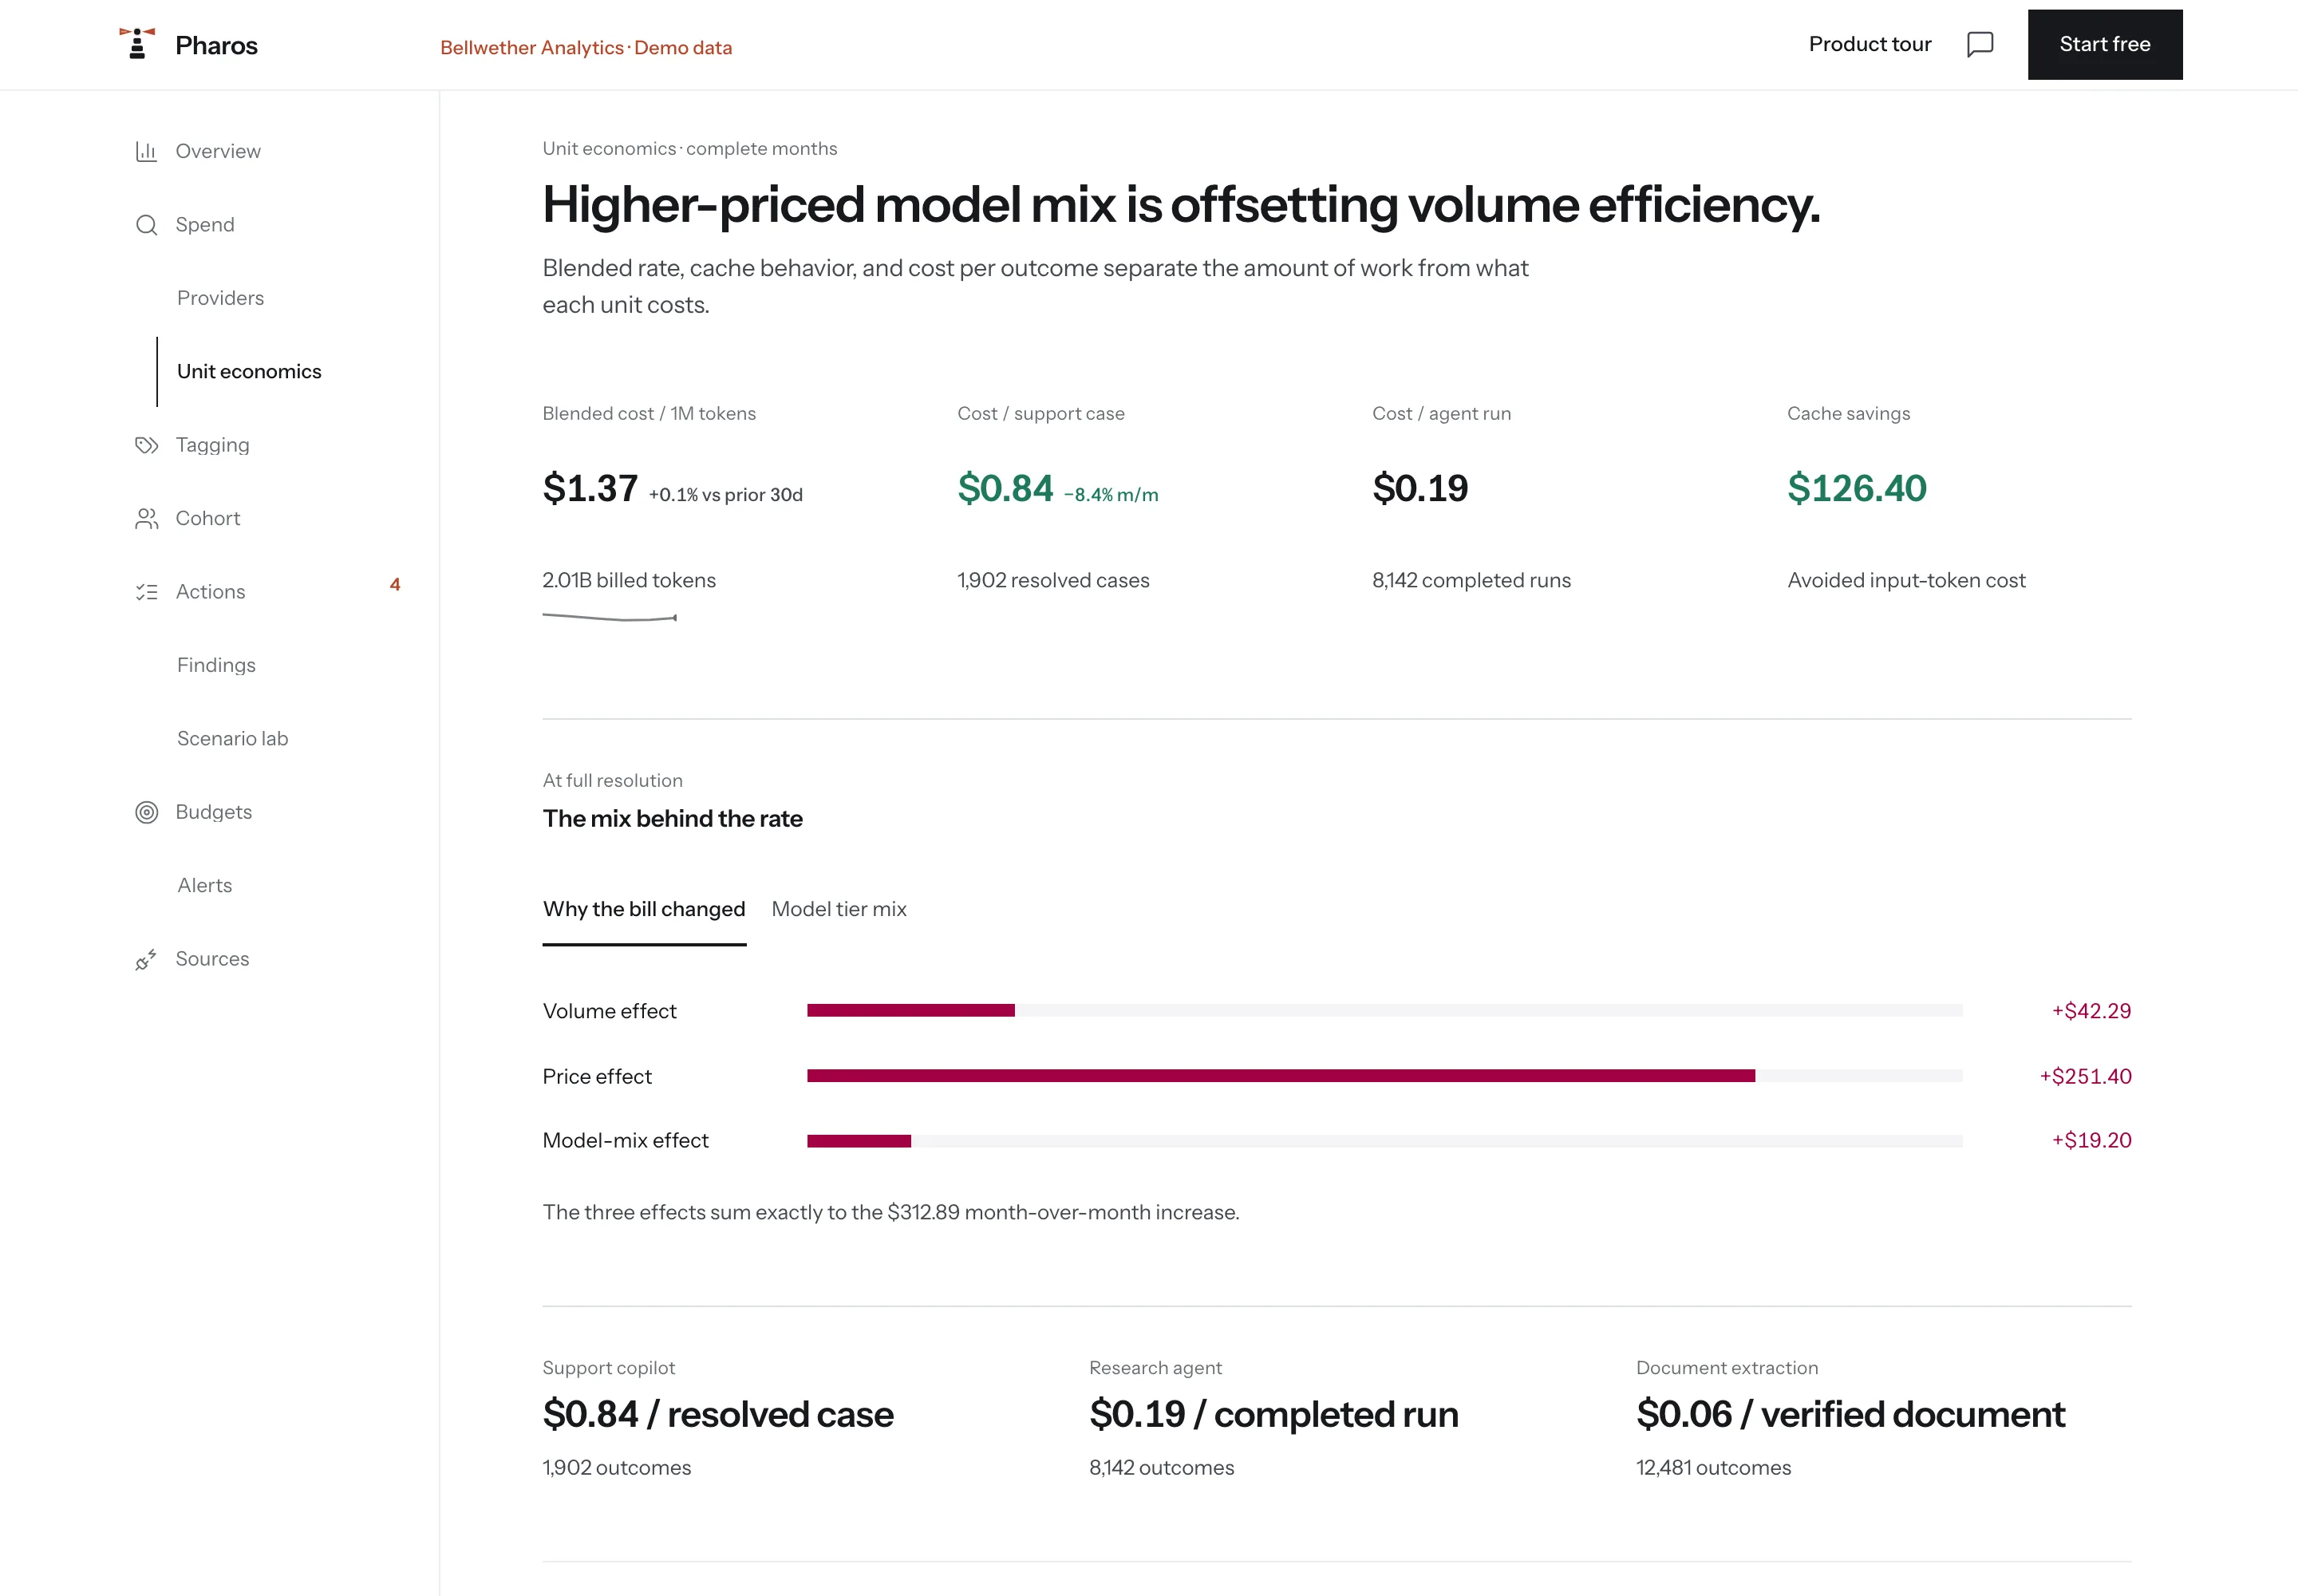
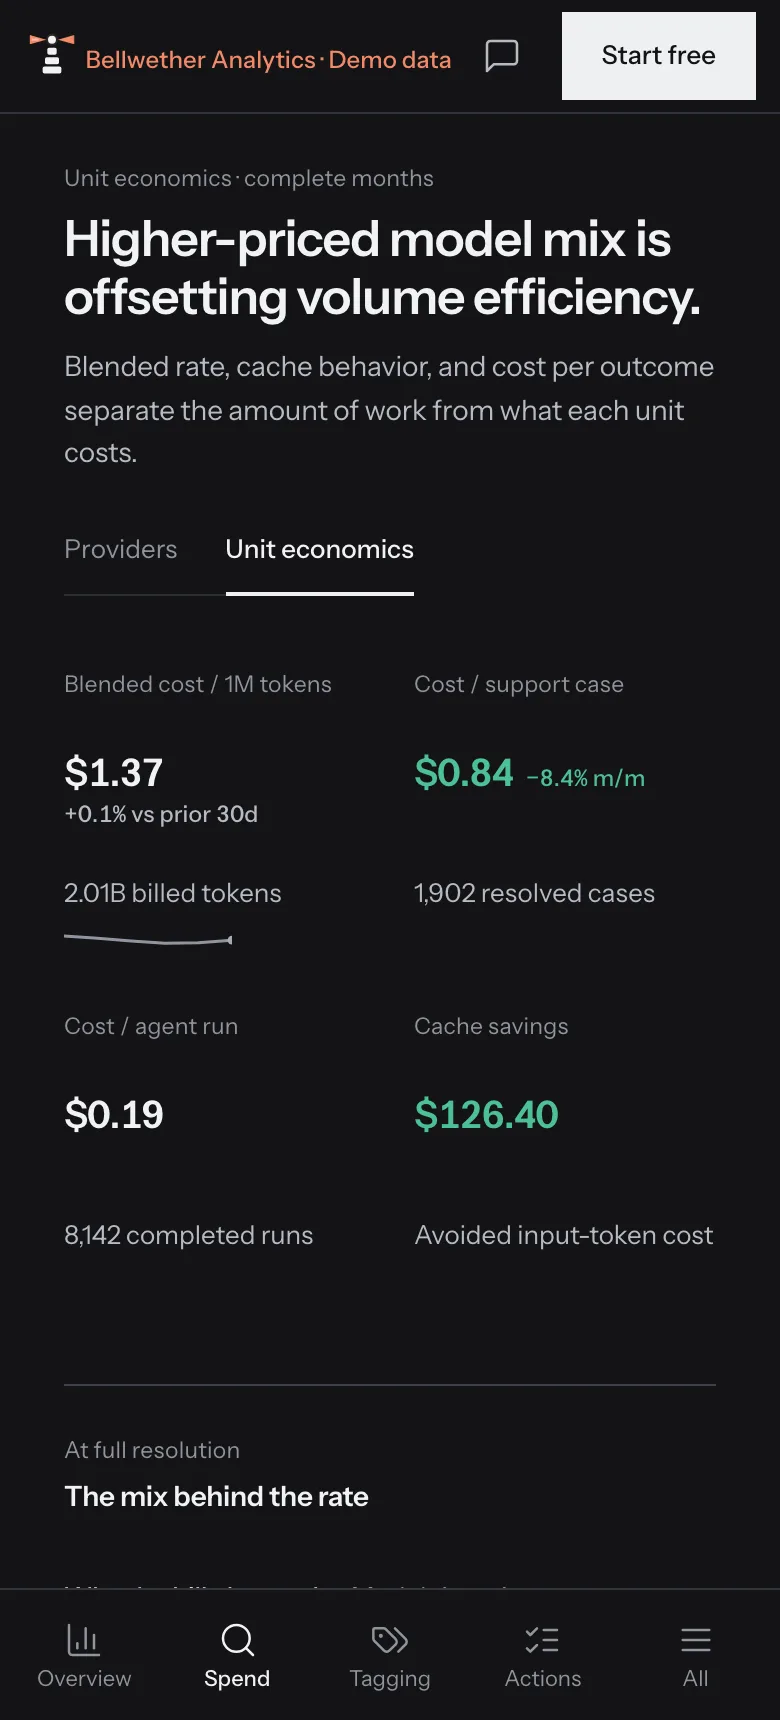
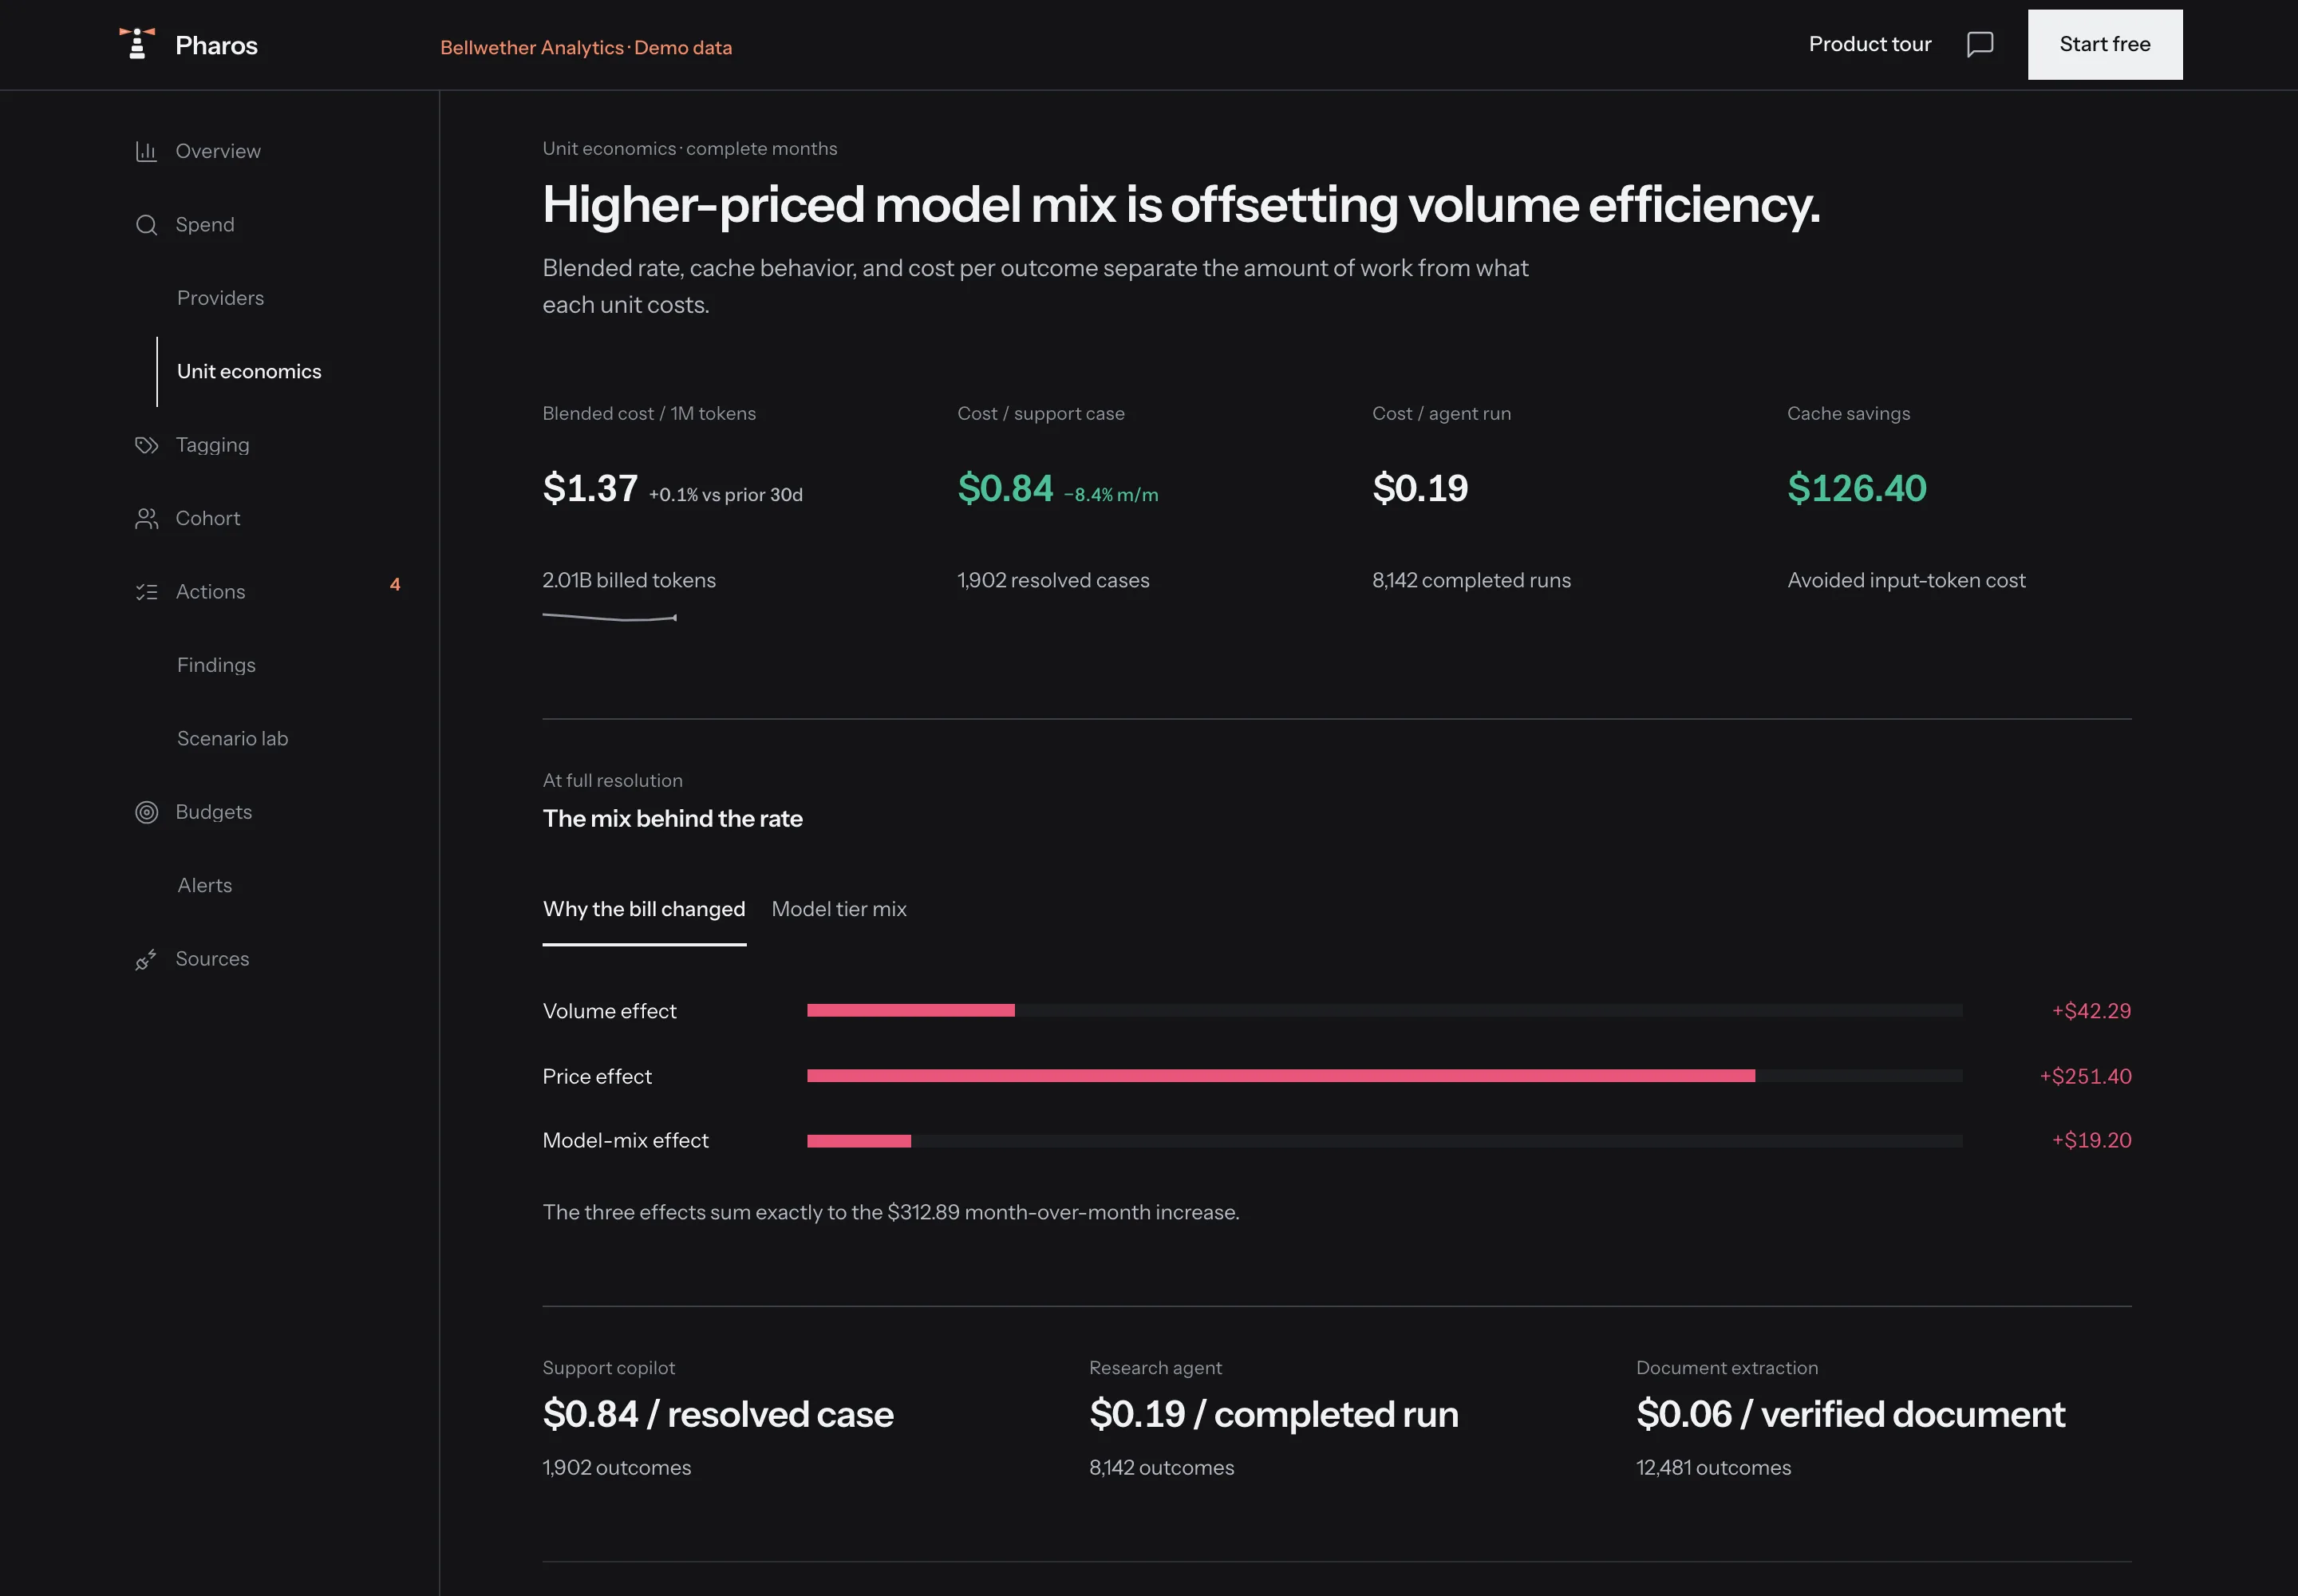
Move from cost per token to cost per outcome.
Track the blended rate beside cost per case, agent run, or business result.
Counted from each vendor’s own integrations and product pages in August 2026. Four rows below go to a competitor, and one Pharos loses outright.
Competitor entries repeat what each vendor publishes, and we have not verified them. “Not stated” means that vendor makes no claim on the page we cite, which is not the same as a no.
If your AI spend is one line inside a bigger cloud bill, or the money goes to GPUs you host yourself, one of the tools above fits you better. Pharos names the source of every figure and tells you where you sit against companies your size. No vendor above claims either.
Questions
FOCUS is an open, vendor-neutral FinOps standard for cost and usage data. Pharos uses it to normalize AI consumption and spend, then adds adoption and business-value evidence for ROI analysis. FOCUS itself does not define adoption or ROI.
AI spend management brings model APIs, AI seat licenses, and infrastructure costs into one view. Pharos forecasts spend against your budget, calculates unit costs, and tracks what each change saved. Every figure links to its source data.
No. Pharos reads provider billing and usage APIs directly. Your cards, bank accounts, and accounting system stay exactly as they are.
No. Pharos reads billing and usage records, and sits outside the request path. It cannot slow a model call down.
From other Pharos workspaces in your industry and size band, one vote per company, shown as percentiles. Pharos publishes a group once 10 companies match your profile. Below that, a percentile would really be one company's number, so nothing is published. Until your group forms, Pharos compares you against your own history and cites published market figures with their sources.
No. Code computes every figure. Ask Pharos uses the relevant experts to explain your records, compare options, and recommend next steps. Forecasted values are labeled Pharos estimate.
No. Connecting backfills your history once. After that, syncs run on a schedule or when you ask for one, and the pages read what is already stored.
Yes. Create a private workspace. If a provider has no personal billing API, upload its invoice or usage export instead.
Pharos supports 27 sources across AI applications, model APIs, gateways, and cloud platforms. 12 sync through read-only reporting APIs; every source also accepts invoices or compatible usage exports. The Connectors page shows the exact reporting method and evidence available for each one.
Connect read-only reporting access, or upload an invoice. One month of data usually answers the question that sent you here.